
download: https://metavilabs.com/sites/default/files/share/ibidi_plot_python.zip
Chemotaxis experiments are conceptually simple — but the coordinate systems are not.
If you’ve ever tried to:
-
reproduce ibidi’s chemotaxis plots outside their software,
-
validate migration direction numerically,
-
or explain to a colleague why “down in the image” becomes “up in the plot”,
you’ve probably discovered that coordinate systems are the real experiment.
At MetaVi Labs, we recently ran into this exact problem while validating automated chemotaxis analysis. The result is a free, open Python tool that reproduces ibidi-style plots correctly — and, more importantly, makes the underlying math explicit.
This post explains why ibidi plots look the way they do, and introduces a tool you can use (and trust).
The core confusion: image space vs. ibidi space
ibidi track exports (ibidi_tracks.txt) are stored in image pixel coordinates:
-
Origin: top-left of the image
-
+X → right
-
+Y → down
This is standard for images — but not for math, physics, or plotting libraries.
ibidi, however, does not analyze tracks in image space.
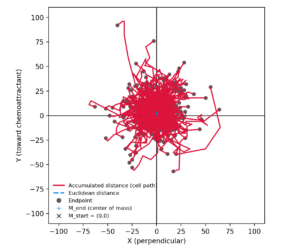
Instead, it constructs a gradient-relative coordinate system:
-
+Y (ibidi) = toward the chemoattractant
-
+X (ibidi) = perpendicular to the gradient
-
(0,0) = a cell-defined reference (not a chamber location)
Crucially:
The reservoir is never plotted.
It exists conceptually “somewhere in +Y”.
Once you realize this, most of the apparent contradictions disappear.
Why plots flip, rotate, or “look wrong”
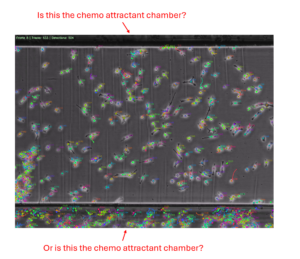
Here’s a common real-world scenario:
-
The chemoattractant reservoir is at the bottom of the image
-
Cells visibly migrate downward in the movie
-
The ibidi plot shows cells migrating “up”
Nothing is wrong.
What’s happening is:
-
Image +Y (down) is being reinterpreted as +Y_ibidi (toward reservoir)
-
The plot is not a map of the chamber
-
It is a map of displacement relative to the gradient
If you intentionally tell the software the wrong reservoir location, the plot rotates accordingly — often making real forward motion appear as perpendicular drift. That behavior is actually a feature, not a bug: it exposes incorrect assumptions instead of hiding them.
Our approach: make the gradient explicit
To eliminate ambiguity, we designed our tool around a single explicit input:
This mirrors the semantics many teams already use internally (for example, in C# or MATLAB pipelines):
From this, the tool constructs a clean, deterministic transform:
-
+Y_ibidi is always toward the chemoattractant
-
+X_ibidi is always perpendicular (90° clockwise)
-
Image orientation, camera mirroring, and plot conventions no longer matter
The result is a plot that matches ibidi’s conceptual model, not just its appearance.
What the free tool does
The MetaVi Labs ibidi plot tool:
-
Reads ibidi Tracks TSV exports correctly
-
Normalizes tracks (per-track or center-of-mass)
-
Transforms image coordinates → ibidi coordinates
-
Produces:
-
trajectory plots
-
endpoints
-
center-of-mass vectors
-
-
Behaves diagnostically when the wrong reservoir edge is chosen
It is designed to be:
-
transparent
-
debuggable
-
and suitable for scientific validation
Why this matters
If you are:
-
validating automated analysis,
-
comparing multiple experiments,
-
integrating chemotaxis into a larger pipeline,
-
or publishing quantitative migration metrics,
then understanding the coordinate transform is essential.
Silent axis flips are dangerous.
Explicit transforms are trustworthy.