For additional assistance, please contact support@metavilabs.com.
Chemotaxis
Fast Track AI chemotaxis measures directed cell movement on thousands of cells in time-lapse movies. This system is based on our Artificial Intelligence engine which has been trained to recognize cells. We have curated a training set with tens of thousands of examples. If your cells are not tracked correctly, please contact us and we will train the system on your cells also.
Contents
Benefits of FastTrack AI For Chemotaxis Imaging Mode Pixel Resolution and Field of View Time Between Frames Important Parameters Exclude cells by Minimum Track Duration Exclude Cells by Movement Threshold Maximum Analysis Time Duration Rotations Force the Analyzer to Find only Large Cells Force the Analyzer to Use the Movement Threshold Force the Analyzer to Use the Minimum Track Duration If your Cells are Too Big to be Detected Don't Draw Tracks and Don't Number Cells Set the Maximum Distance to Connect Tracks Excluding a Region of Interest Manually Setting the Region of Interest Accessing the Results Interpreting the ResultsSample tracked movie from FastTrack AI - Chemotaxis.
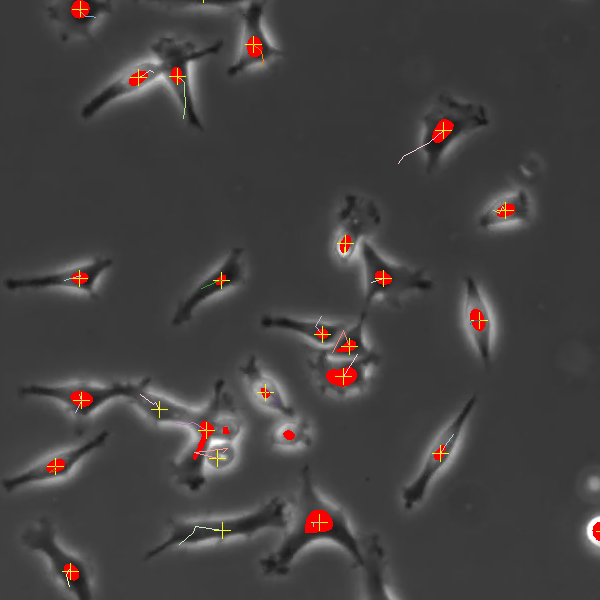
Demonstration of un-processed user-supplied time-lapse (left), FastTrack AI predictions (center), fully tracked result (right).
Benefits of FastTrack AI For Chemotaxis
While several automated tracking software packages are on the market, most require careful adjustments to image processing parameters such as thresholding and contrast. These software solutions often rely on techniques developed in the early days of image analysis for object classification. These crude methods are error prone and require user intervention. Modern methods use complex filters which recognize shapes much more like the human vision system.
Some important advantages of the FastTrack AI system:
- Highest accuracy of cell identification on a wide array of cell morphologies
- Tracks very high numbers of cells (up to 1000 per image) for much higher relevance of results
- Saves hundreds of hours of labor over manual tracking
- Improved accuracy over human tracking
- Works on Phase contrast with no labels or dyes required
- Complete end to end solution for full automation for high content screening applications
- Very simple drag-and-drop interface for maximum ease-of-use
- Very comprehensive reports with easy to read condition comparison charts and also raw-data
Imaging Mode
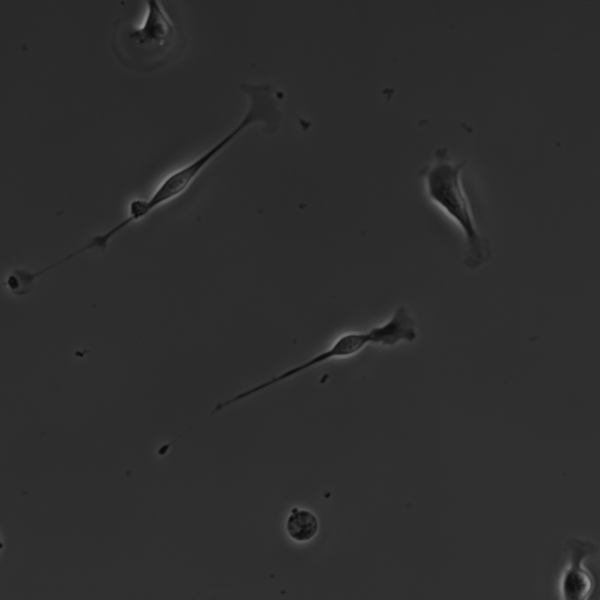
The microscope should be setup to use Phase Contrast as it will provide an image with maximum constrast of the cell walls (see example below). However, if transmission light is used and the cells are in sharp focus, this can be used in some limited circumstances.
Pixel Resolution and Field of View
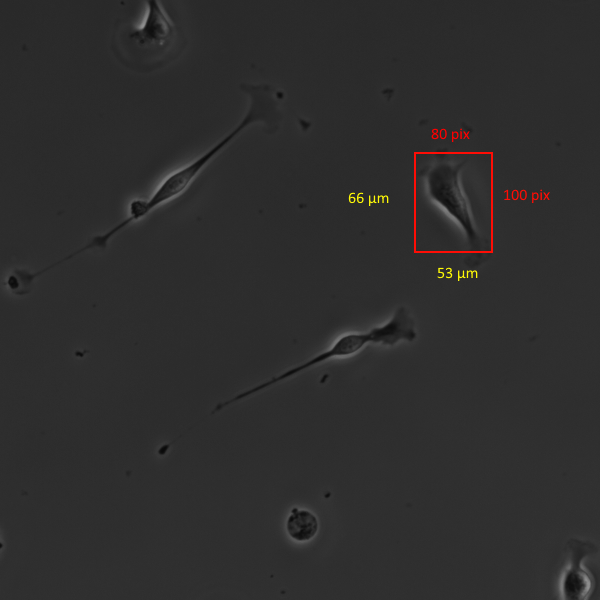
The image pixel resolution should be as high as possible (1.5 to 2.0 pix/µm). This is determined by the resolution of the camera attached to the microscope. For example, a good camera with pixel dimensions of 2000 W x 2000 H covering an vertical field of view of 1.5 mm would provide 2000/1500 = 1.33 pix/µm. The sample image below has a pixel resolution of 1.5 pix/µm. Its is very important to enter the correct resolution number when settting up the experiment. The analyzer uses this resolution number to convert from pixels to µm for all speed and distance calculations. For more information on calculating the resolution please refer to the Help Center page on pixel resolution.
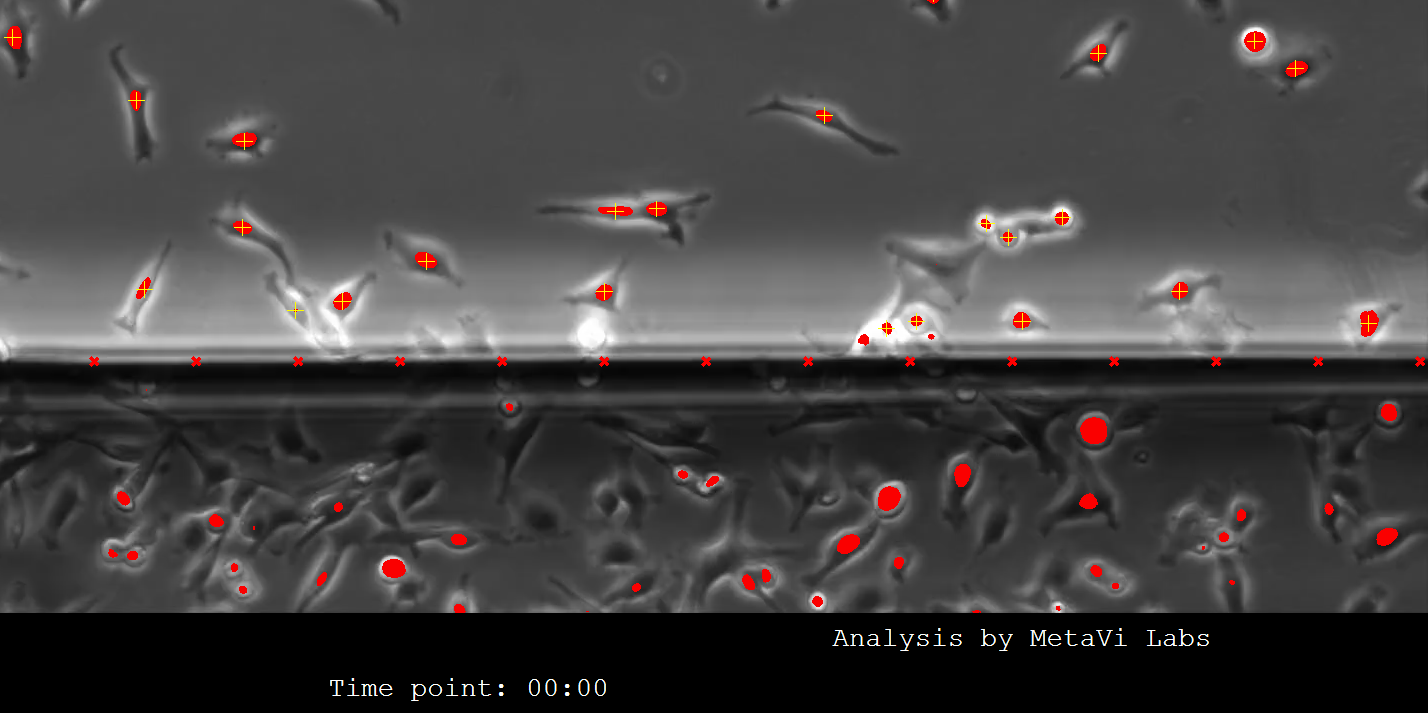
For maximum effectiveness of the assay, the chamber walls should be just visible. The analyzer will find the chamber walls and not track cells on the outside of the chamber.
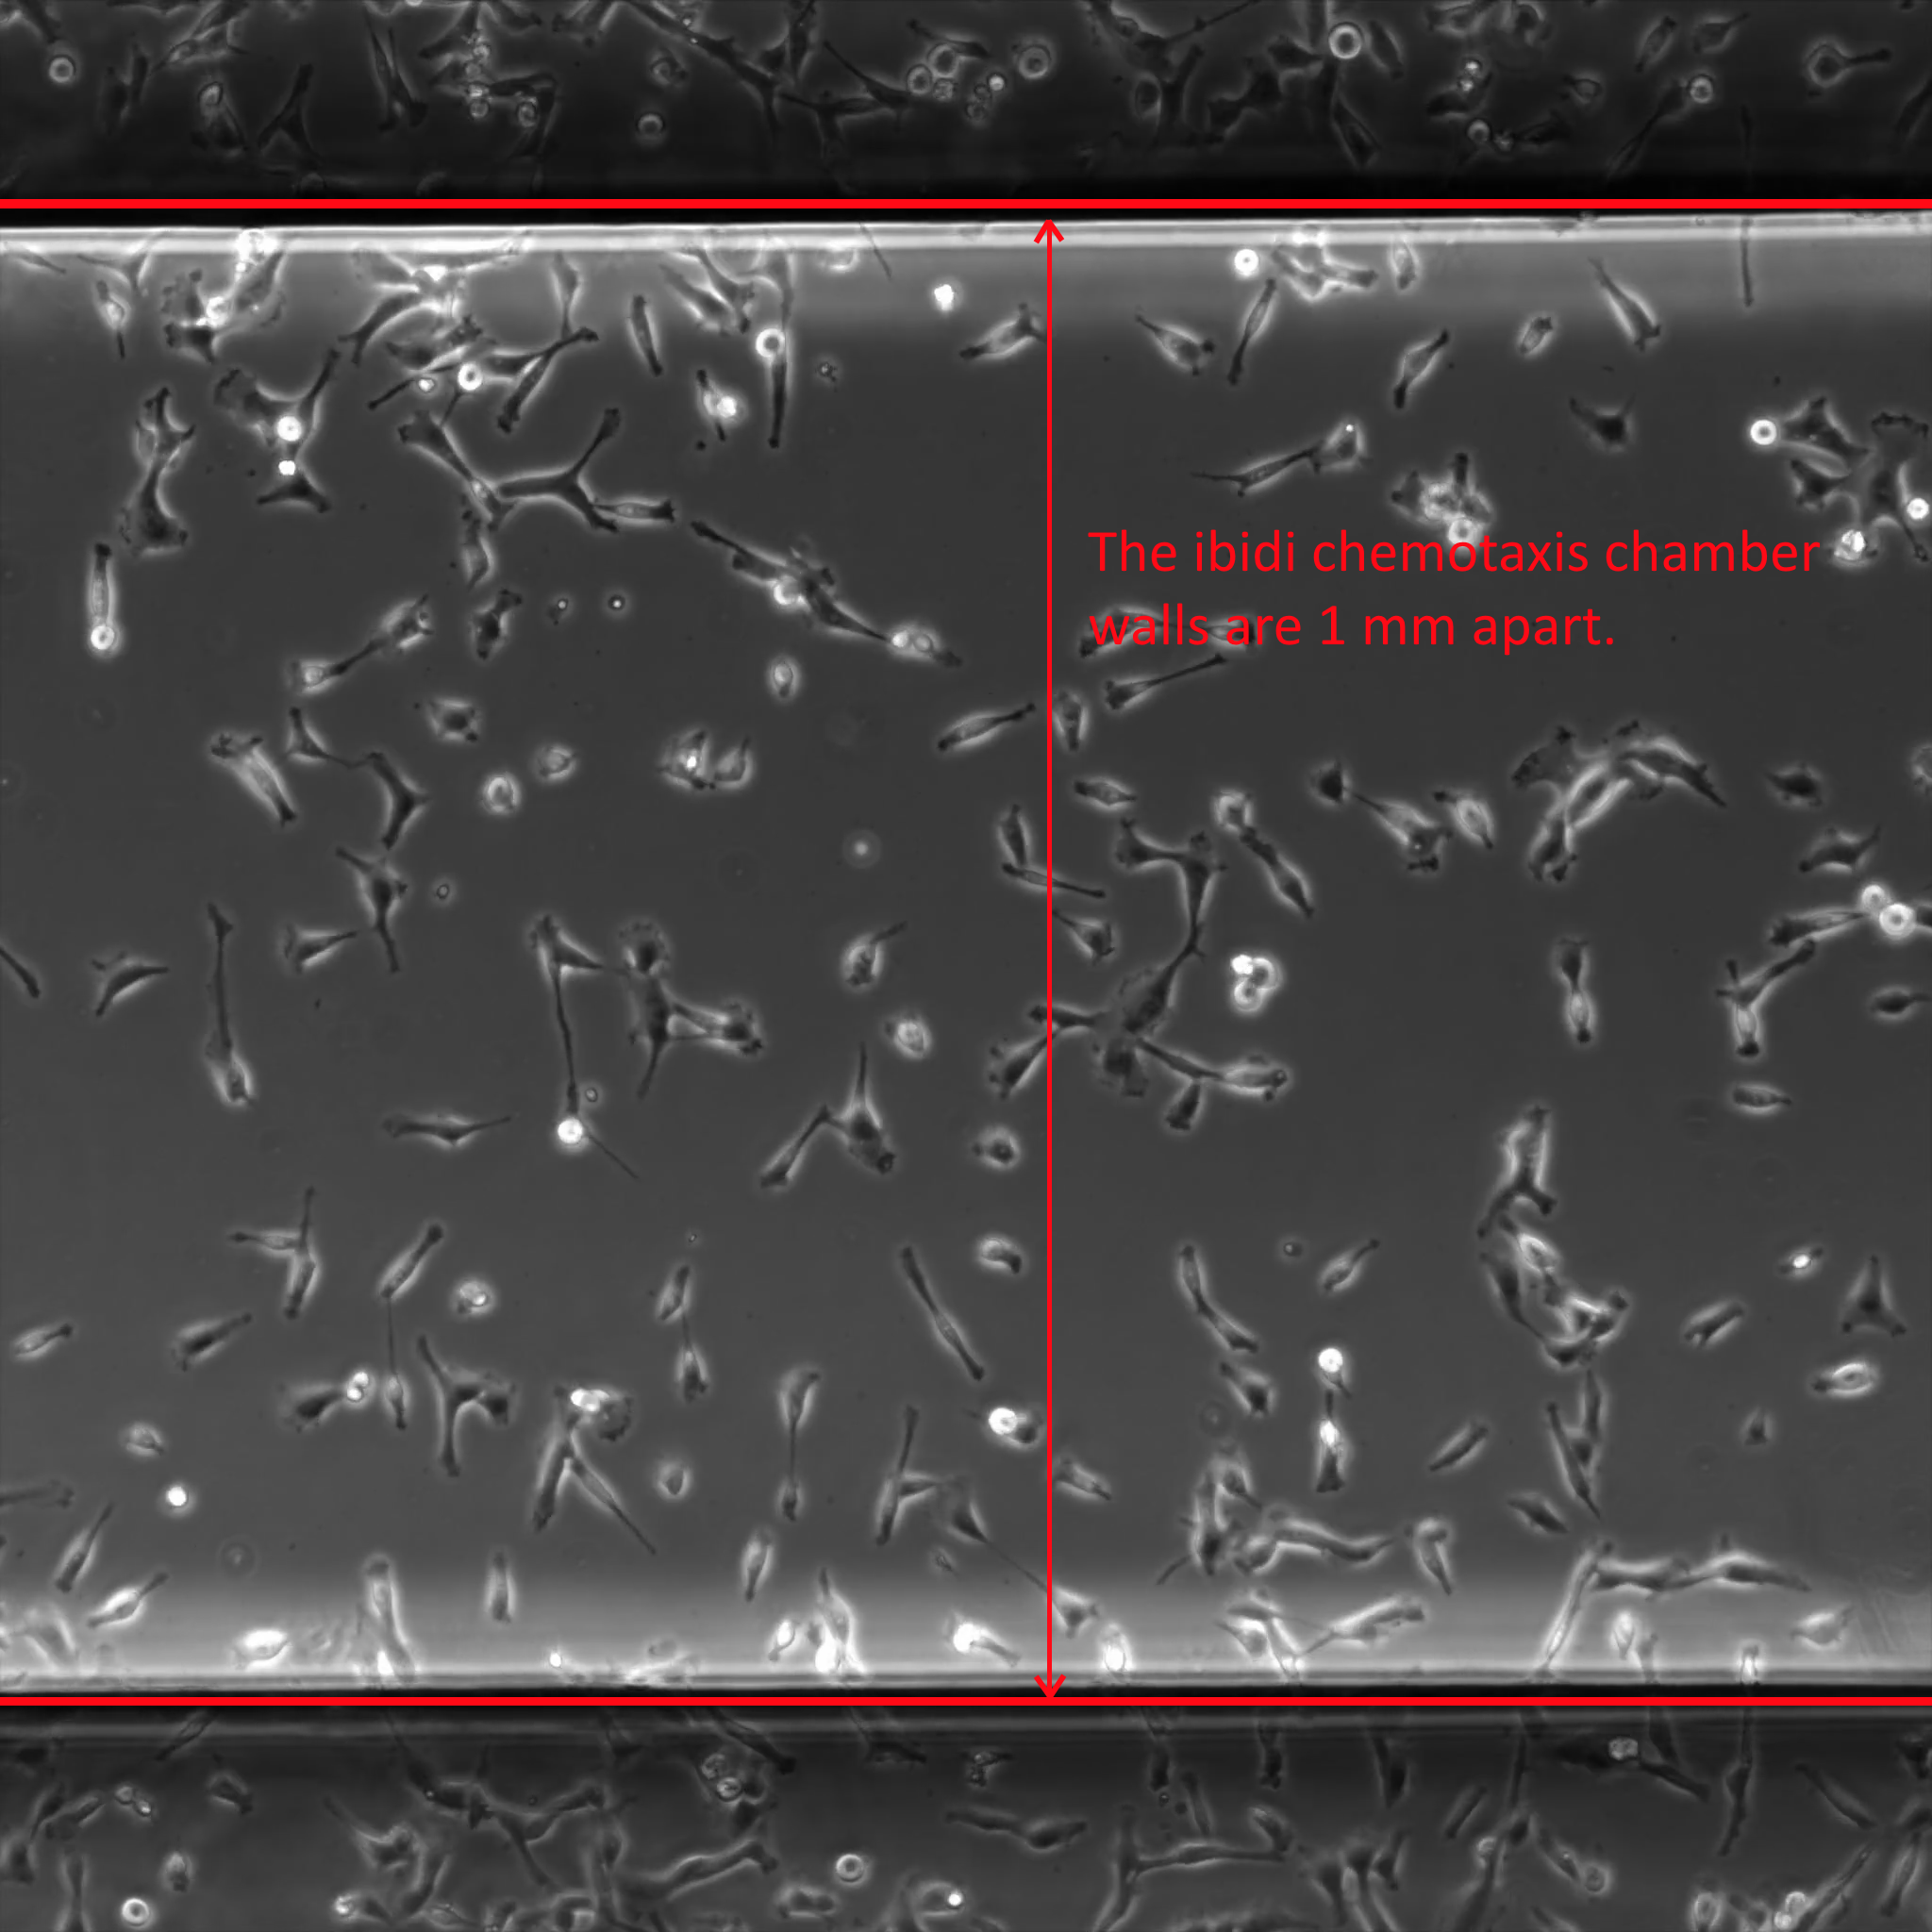
Cells must be 50 pixels inside of the chamber wall to be tracked. You will see in the image below that the AI engine marks all cells in the image, but only those with a yellow + mark are being tracked. So cells touching the chamber wall are excluded from the analysis.
Time Between Frames
Time between frames in the time-lapse recording is very important. Cells move fast and if your capture rate does not keep up, it will not be be possible to accuractly track the cells. Large cells can move 30µm in a single step. T cells move very fast. For ibidi chemotaxis chamber experiments with a 1mm to 2 mm field of view, 2 minute per frame is suitable for most cell types. For slow moving cells, 4 minutes per frame may also be acceptable. It will be import to run some trial experiments to determine the optimal time for your specific cells and conditions.
If the cells move too far in one single image step, and the cells are tightly grouped, then you may see the tracks switching from one cell to another. The algorithm attempts to match cells in new frames with the nearest track in the previous frame. If two cells swap positions, this can cause an error in track assignment. This can be resolved by reducing the time between frames (i.e. increasing the capture rate).
Important Parameters
When you create a Chemotaxis experiment in FastTrack AI, its very important to set the pixel resolution and time between frames correctly. Once your experiment has been created in FastTrack AI, you may to adjust some parameters used in the reports.
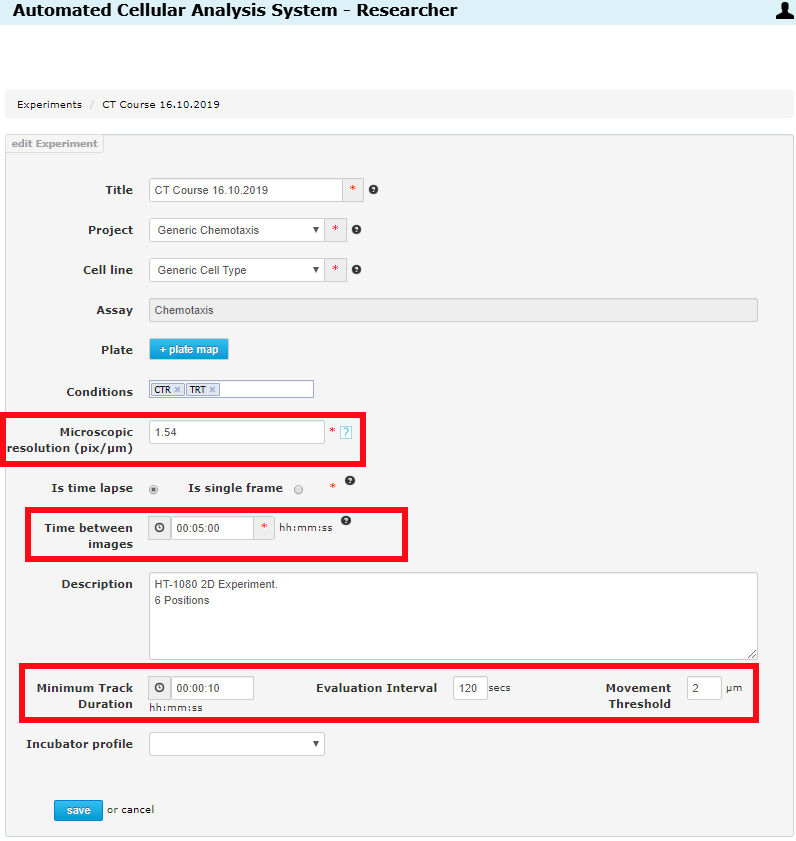
Inside the experiment edit page, you will see the important settings:
- Microscopic Resolution -
This is the pixel/µm image resolution as discussed above.
- Time Between Frames -
This is the frame record time interval in the time-lapse movie.
- Minimum Track Duration -
Tracks which do not exist for this minimum time will be excluded from the reports.
- Evaluation Interval -
Speed calculations are evaluated using this time interval (distance/evaluation-interval-seconds).
- Movement Threshold -
Cells which move less than this number of microns are considered non-moving. Normally, both moving and non-moving cells are including the report, but caculated seperately.
To modify the parameters you must open the parent Experiment page and edit the Experiment. To edit the experiment you must navigate to the Experiment page. Either start by opening the project, then open the Experiment in the project. Or if you are already in the Replicate page, you can follow the link at the top of the page, as shown below:
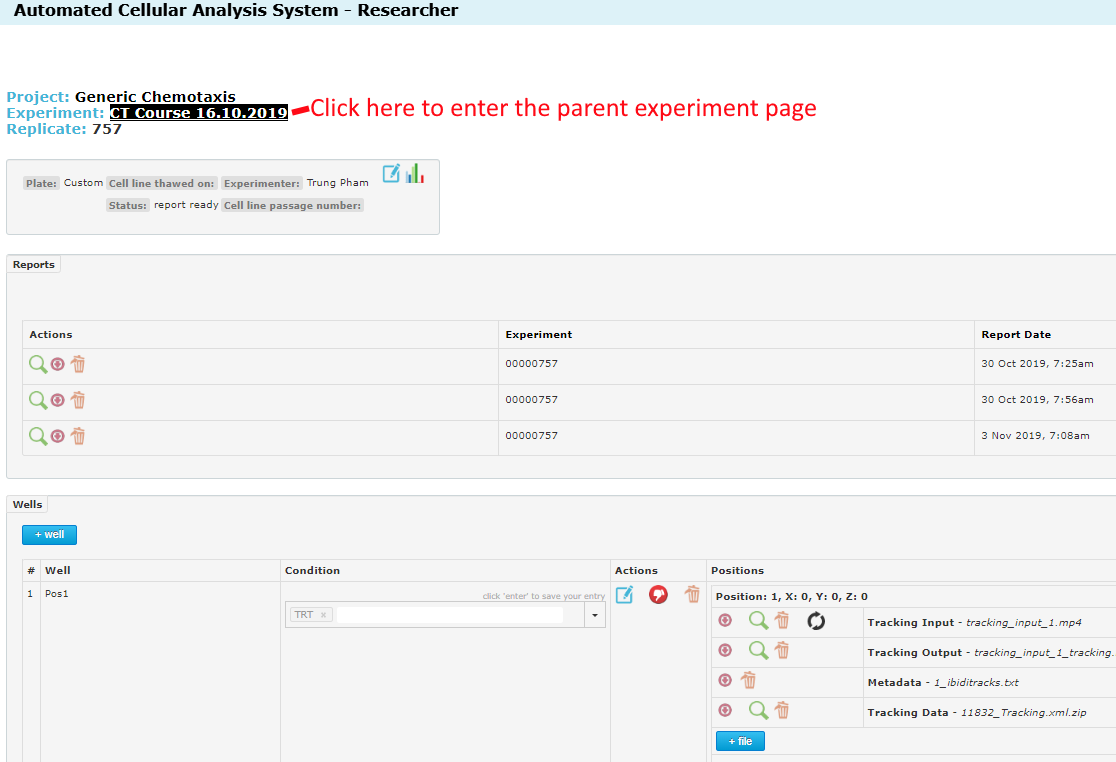
Once inside the experiment page, you will see the edit icon at the top. Click this:
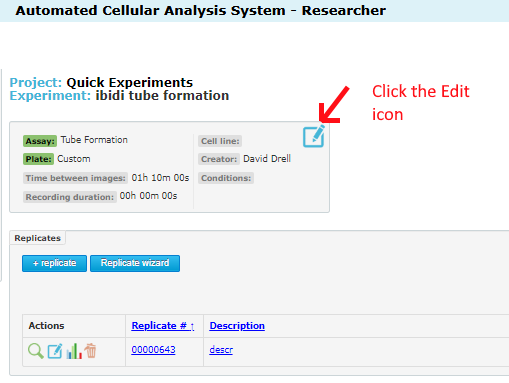
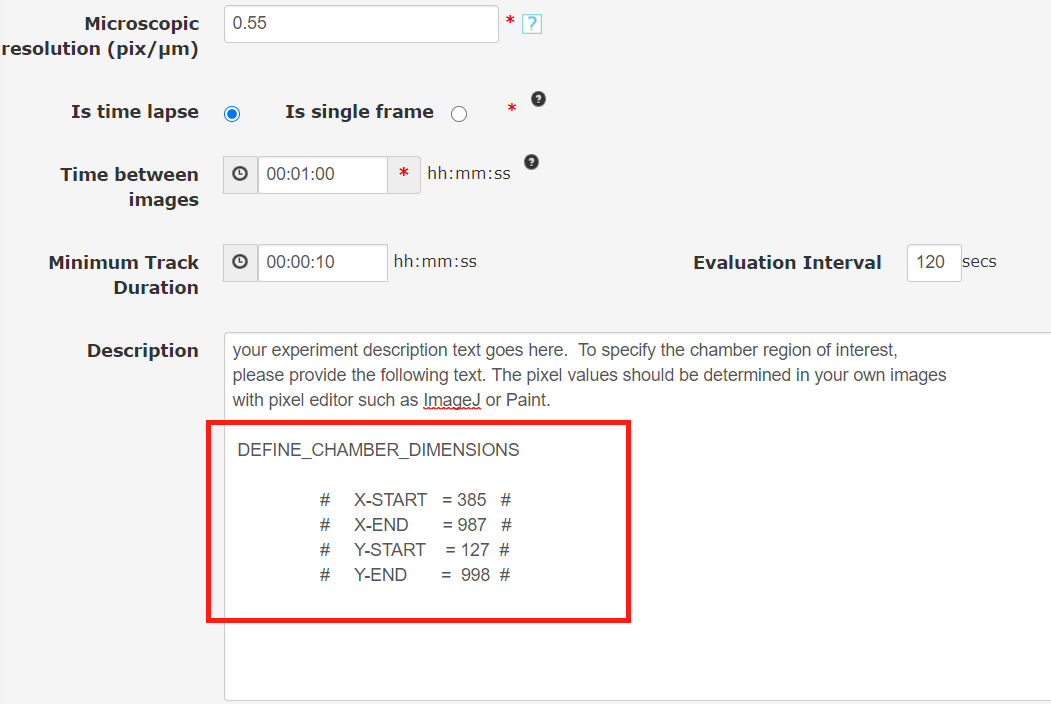
Once inside the experiment edit page, you will see the important settings:
- Microscopic Resolution - this is the pixel/µm image resolution as discussed above.
- Time Between Frames - this is the frame record time interval in the time-lapse movie.
- Minimum Track Duration - tracks which do not exist for this minimum time will be excluded from the reports.
- Evaluation Interval - Speed calculations are evaluated using this time interval (distance/evaluation-interval-seconds).
- Movement Threshold - Cells which move less than this number of microns are considered non-moving.
The first two (Microscopic Resolution, Time Between Frames) are important for initial movie tracking and must be set correctly before a movie is tracked. If you change one of these, the movies must be re-tracked (and this will use your purchased track-jobs). The last three (Minimum Track Duration, Evaluation Interval,Movement Threshold) are important for the reports. You can re-generate as many reports as you like (no charge). So feel free to adjust these settings to see the effect it has on your results and to determine the optimum settings for your experiments.
- Microscopic Resolution - important for well tracking.
- Time Between Frames - important for well tracking.
- Minimum Track Duration - important for report generation.
- Evaluation Interval - important for report generation.
- Movement Threshold - important for report generation.
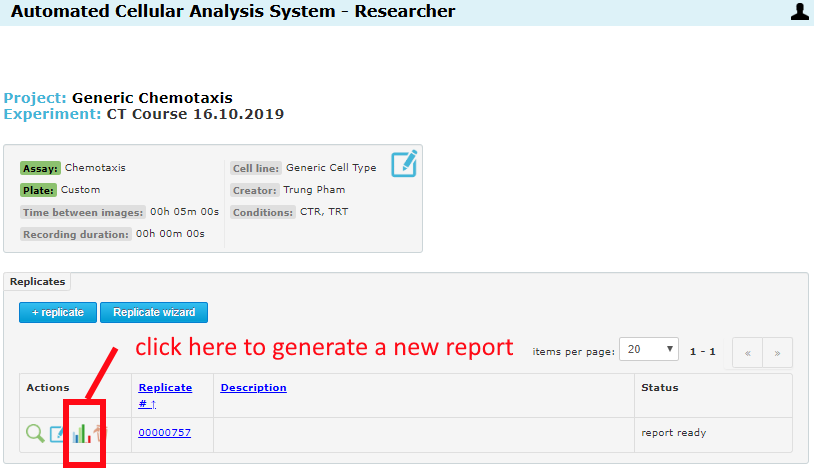
If no reports have been generated when you change these settings, they will take effect on the next report job (generated automatically when all wells in the replicate have been analyzed). If you change a setting after a report has been generated, just re-generate a report. There are two places where this can be done.
From the Experiment page, regenerate a report for any replicate:
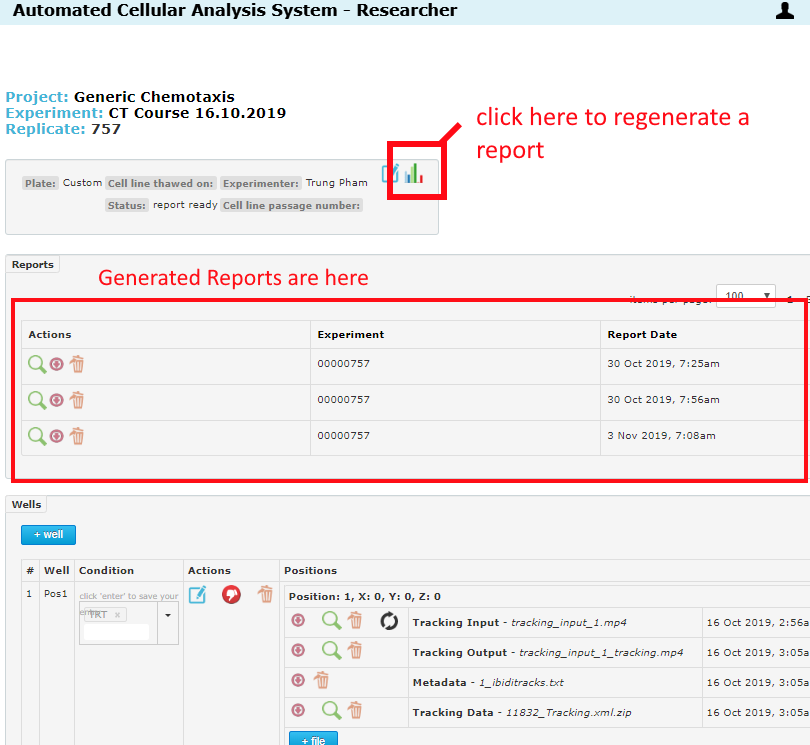
From inside the replicate page, regenerate for this specific replicate:
Exclude cells by Minimum Track Duration
Minimum Track Duration - Cell tracks with a life-time less than this time duration are considered non-valid cells. Normally, the report includes the count of all cell tracks, but indicates the number of valid and non-valid tracks. Only valid tracks are used in the analysis. To set the value of the minimum track duration, refer to this section: Important Parameters Optionally you can choose to exclude all non-valid cell tracks from the report entirely. In this case, all reported cell tracks will be valid and the number of excluded cells will not be reported. To exclude cells under this time threashold, add the special code EXCLUDE_MIN_TRACK_DURATION.
For more information on entering custom codes, please refer to this page: "How to add custom codes". This code is applied when reports are generated. Enter this code exactly as shown in addition to your normal description text.
For example, to exclude all cell tracks with a life-time under this threshold from the report, add this code to the experiment description and create a new report:
EXCLUDE_MIN_TRACK_DURATION
Exclude cells by Movement Threshold
Movement Threshold - Cells which move less than this number of microns are considered non-moving. Normally, both moving and non-moving cells are including the report, but caculated seperately. The default is for the the report to indicate the number of moving and non-moving cells. However, you can choose to completely exclude non-moving cells from the report entirely. To exclude cells under this threashold, add the special code EXCLUDE_MOVEMENT_THRESHOLD.
To set the value of the movement threshold, refer to this section: Important Parameters
For more information on entering custom codes, please refer to this page: "How to add custom codes". This code is applied when reports are generated. Enter this code exactly as shown in addition to your normal description text.
For example, to exclude all non-moving cells from the report, add this code to the experiment description and create a new report:
EXCLUDE_MOVEMENT_THRESHOLD
Maximum Analysis Time Duration
If you want a chemotaxis/migration analysis for only a fraction of the recorded time, you can set a time maximum for the analysis (report generation). This time is set in minutes.
The analysis system determines the time at each frame from the time-between-frames parameter supplied by the user in the Experiment setup.
For more information on entering custom codes, please refer to this page: "How to add custom codes". This code is applied when reports are generated. Enter this code exactly as shown in addition to your normal description text.
For example, to limit the analysis time to 180 minutes, enter the following code:
# MAX_DURATION_MINUTES = 180 #
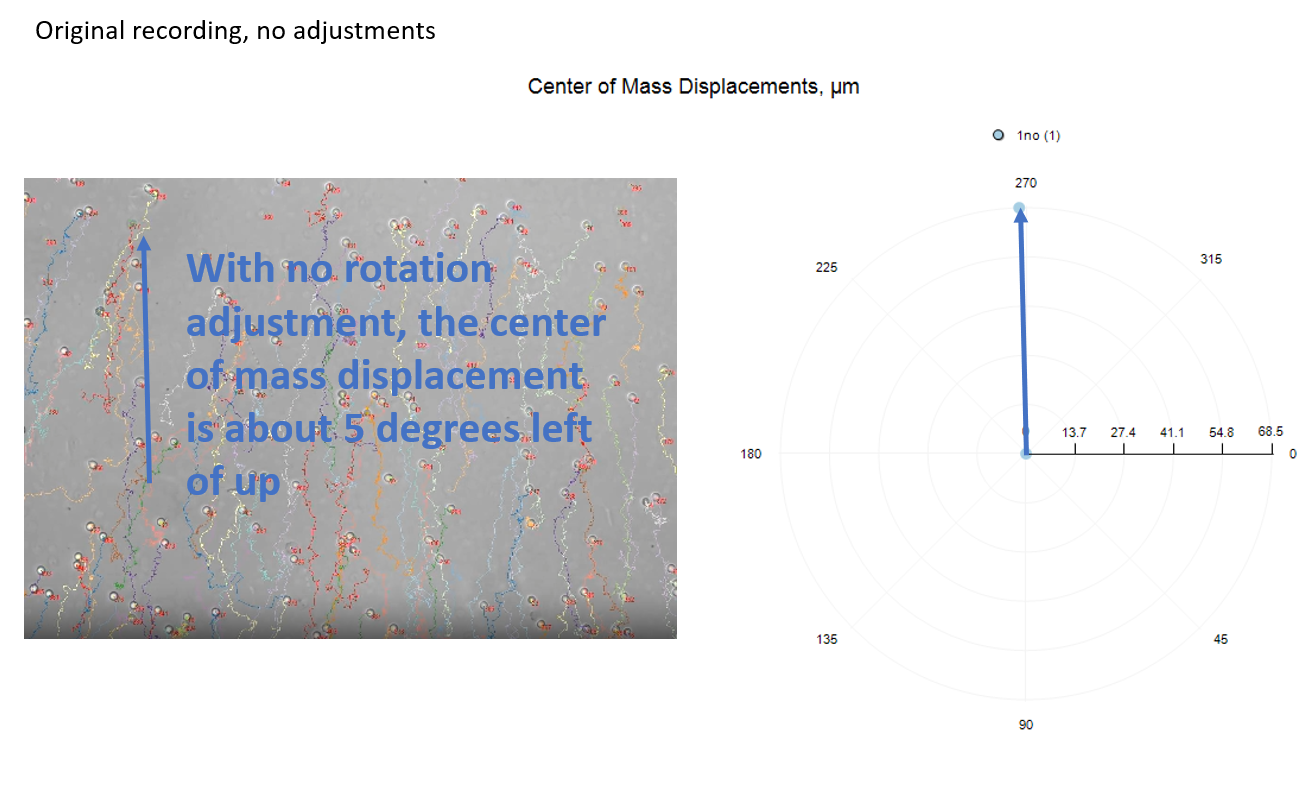
Rotations
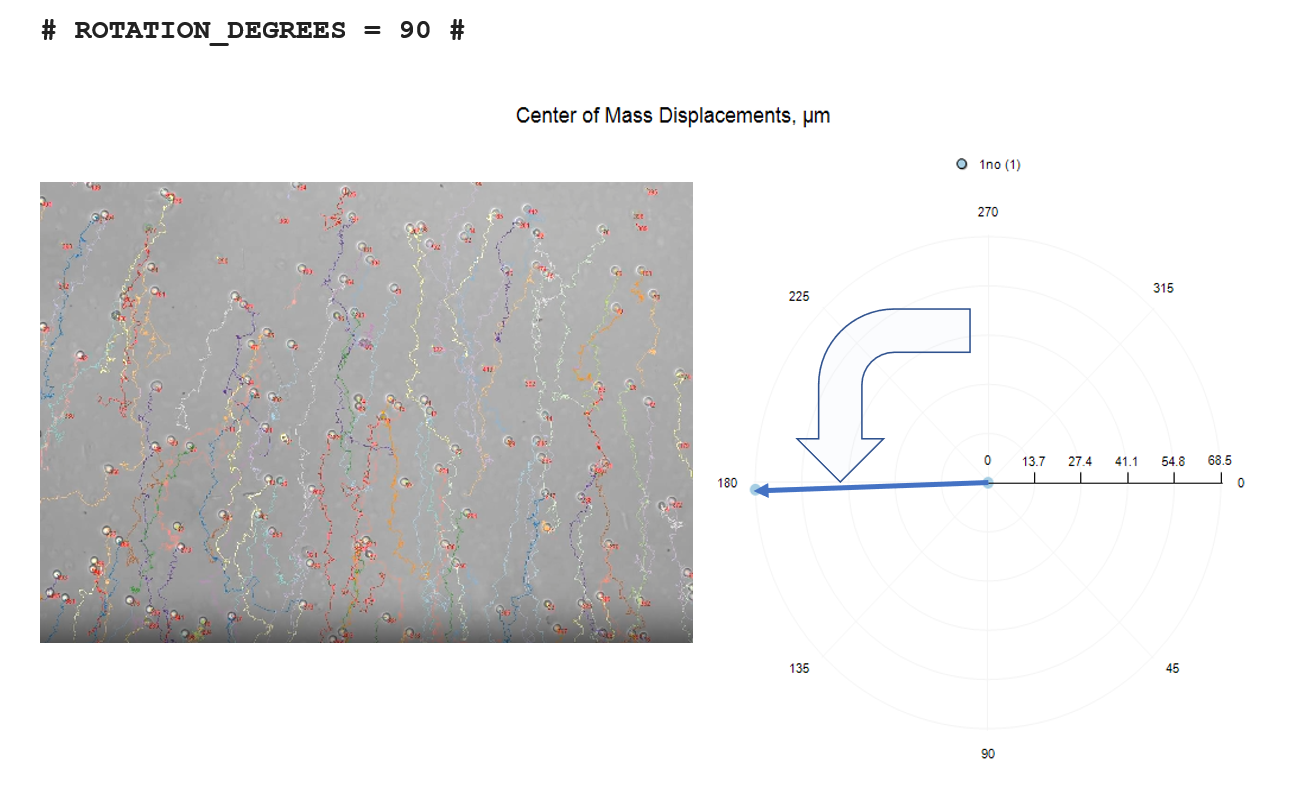
If your chambers have not all been placed on the microscope stage in a consistent orientation, you may need to rotate the orientation in the analysis. FastTrack AI does not provide a method to rotate the cell tracks in the track movie. However, in the reports, the x,y coordinates of each cell track can be rotated by 90, 180, or 270 degrees.
For more information on entering custom codes, please refer to this page: "How to add custom codes". This code is applied when reports are generated. Enter one of these codes exactly as shown in addition to your normal description text:
# ROTATION_DEGREES = 90 #
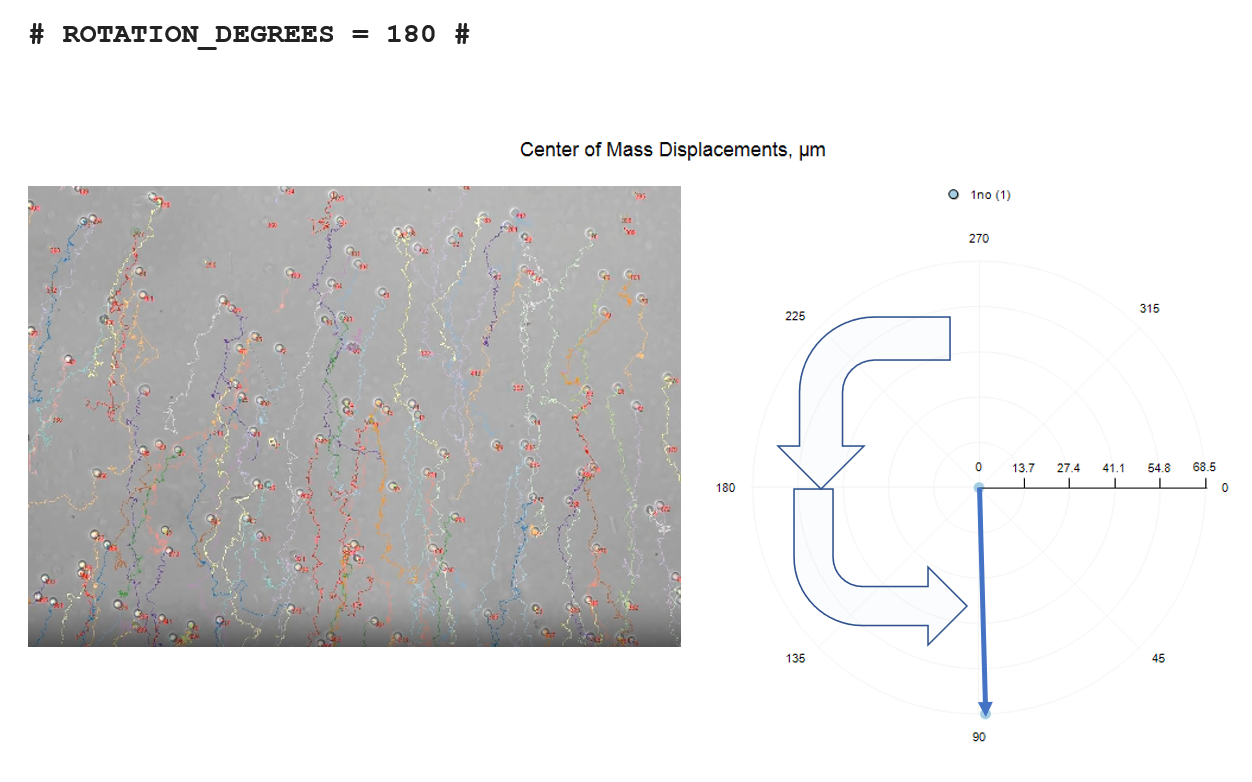
# ROTATION_DEGREES = 180 #
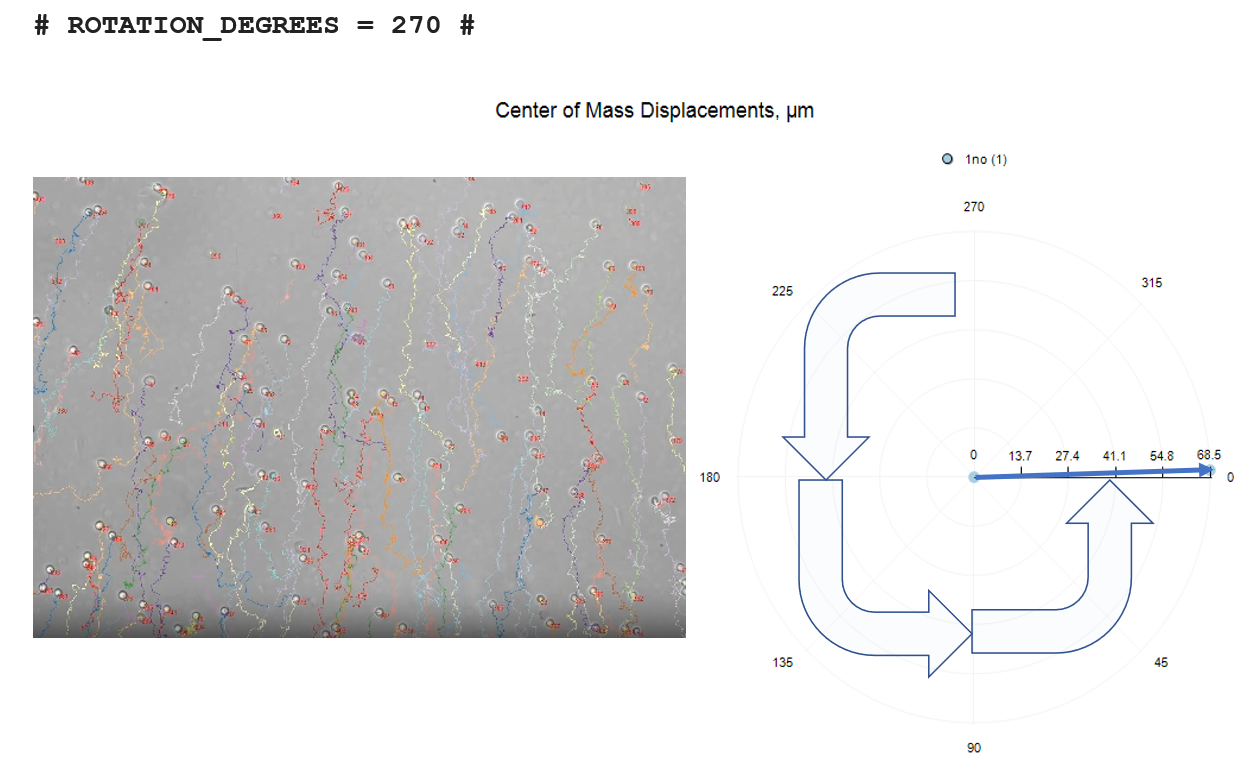
# ROTATION_DEGREES = 270 #
The three rotation options are depicted below, relative to no-rotation.
Force the Analyzer to Use the Movement Threshold
Some cells will not move, especially if these are actually false positives. Normally the movement threshold is a filter applied during the report generation specifically for speed and velocity calculations, but the analyzer marks and reports all tracks. To force the analyzer to remove short distance tracks from both the track movie and the track results meta-data, add this code to the Experiment Description.
When applied to the analyzer, the movement threshold is calculated by comparing each position of the track to the first position of the track, and finding the maximum distance from the first position. If the maximum distance is less than the threshold, that track is removed from the list of tracks.
For more information on entering custom codes, please refer to this page: "How to add custom codes". This code is applied when movies are tracked. Enter this code exactly in addition to your normal description text:
ANALYZER_USE_MOVEMENT_THRESHOLD
Force the Analyzer to Use the Minimum Track Duration
Normally the minimum track duration is a filter applied during the report generation, but the analyzer marks and reports all tracks. To force the analyzer to remove short duration tracks from both the track movie and the track results meta-data, add the code shown below to the Experiment Description.
Tracks that are short lived tend to be false postives so this is a method to reduce or eliminate them. Tracks can also be short lived in cases of high cell densities where it is not possible to maintain a visible lock on the cell.
For more information on entering custom codes, please refer to this page: "How to add custom codes". This code is applied when movies are tracked. Enter this code exactly in addition to your normal description text:
ANALYZER_USE_MIN_TRACK_DURATION
Force the Analyzer to Find only Large Cells
Some images contain visual artifacts that can be interpreted by the AI engine as small cells. If you find that your cells are on the order of 20 to 50 pixels wide but much smaller artifacts (about 10 pixels wide) are also being identified, you can force the analyser to find only large cells by adding the following custom code to the Experiment Description. For more information on entering custom codes, please refer to this page: "How to add custom codes". This code is applied when movies are tracked. Enter this code exactly in addition to your normal description text:
ANALYZER_LARGE_CELLS
If your Cells are Too Big to be Detected
If you find that your cells are on the order of 20 to 50 pixels wide they may not be detected actually as the AI engine has been training on cell images of 10 to 20 pixels wide This problem can be corrected with the following custom code which reduces the image size before processing. For more information on entering custom codes, please refer to this page: "How to add custom codes". This code is applied when movies are tracked. Enter this code exactly in addition to your normal description text. First, try a factor of 2 scaling:
# ANALYZER_IMAGE_SCALE_FACTOR = 2 #
If your cells are really large (20X objective on tumor cells for example), you can try a scale factor of 4 :
# ANALYZER_IMAGE_SCALE_FACTOR = 4 #
Don't Draw Tracks and Don't Number Cells
Cell track drawing is disabled automatically when the cell count exceeds 500 cells. However, if you prefer no tracks, you can disable them completely. All cell tracks are numbered by default, you can optionally disable this feature as well. For more information on entering custom codes, please refer to this page: "How to add custom codes". This code is applied when movies are tracked. Optionally add one or both of these codes to your normal description text:
ANALYZER_DONT_NUMBER_TRACKS, ANALYZER_DONT_DRAW_TRACKS
Set the Maximum Distance to Connect Tracks
To create a cell-track, the algorithm seeks to attach discovered cells to a nearby ending track from the previous frame. The default maximum distance is 30 μm.
If the time-between-images is too large then the cells may move too great a distance between image captures. This tends to randomize the cells and increases the likely hood of errors. This error can be reduced by reducing the maximum track connection distance.
For more information on entering custom codes, please refer to this page: "How to add custom codes". This code is applied when movies are tracked. To reduce your maximum track connection distance to 10 μm, for example Enter this code exactly in addition to your normal description text:
# MAX-TRACK-CONNECTION = 10 #
Excluding a Region of Interest
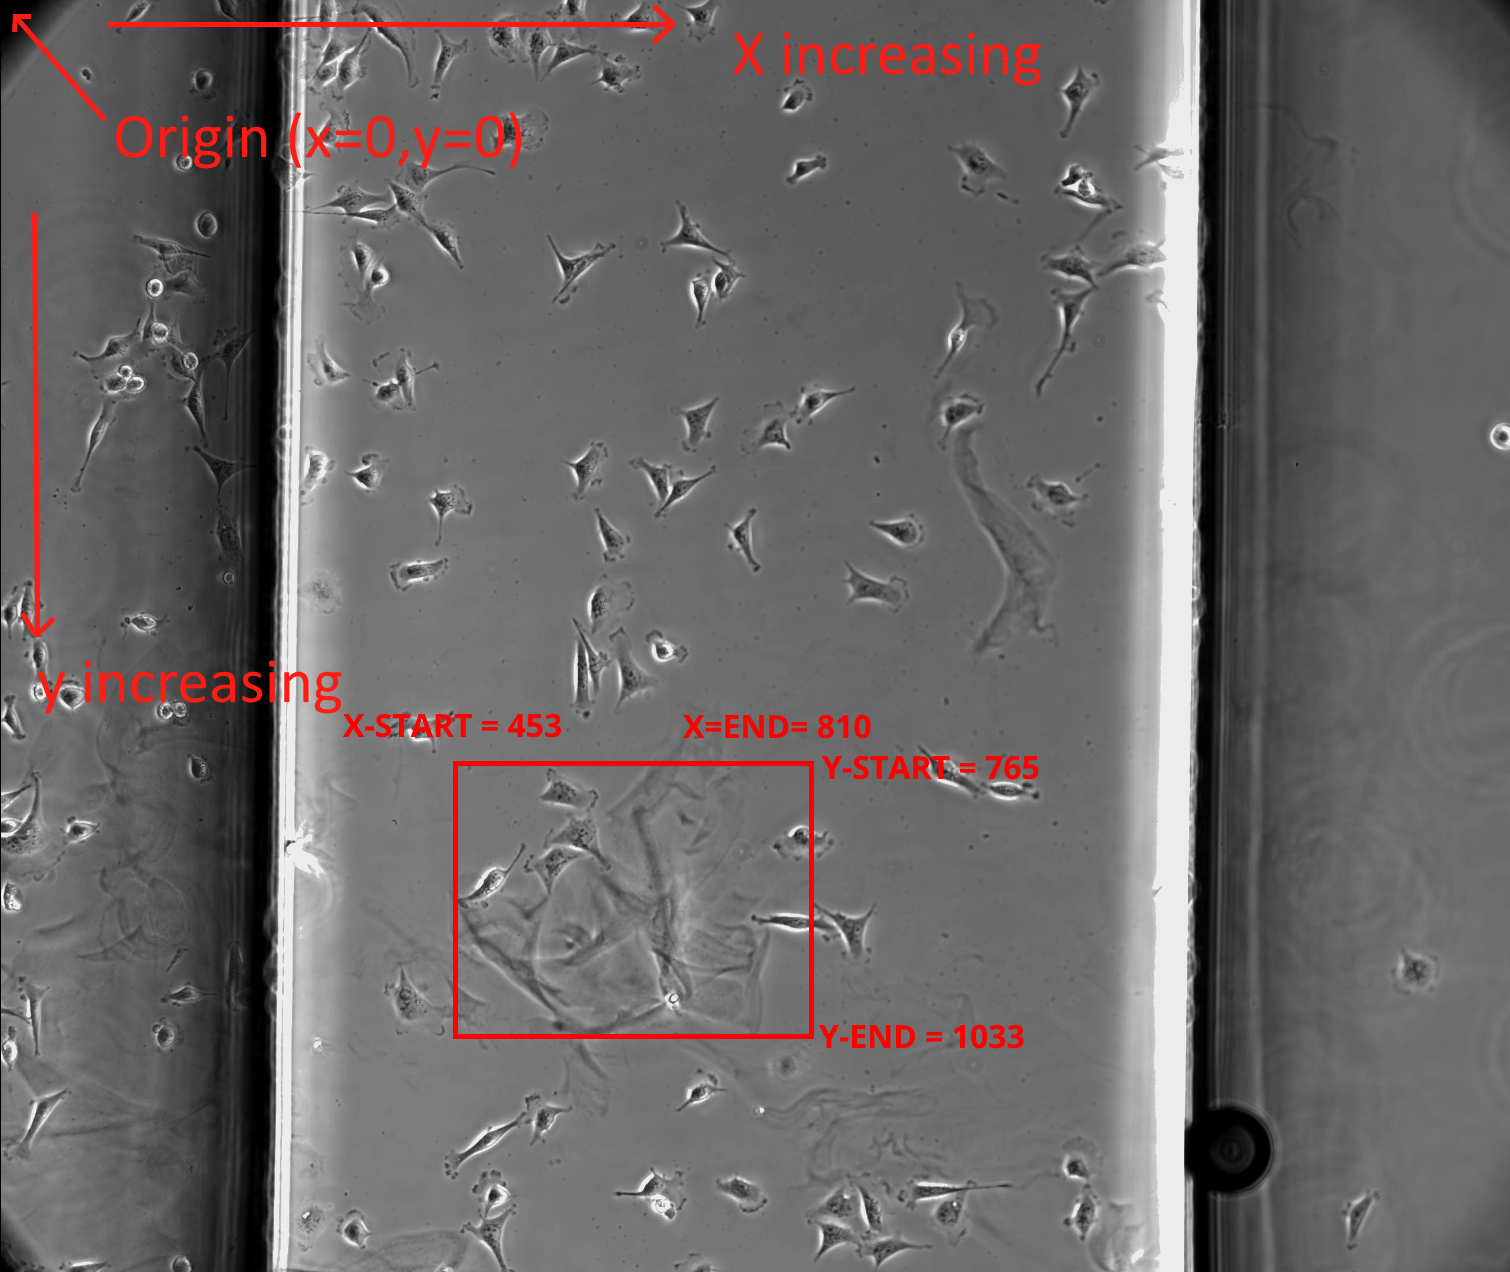
You may want to exclude one or more regions from analysis. The software allows the user to specify rectangular regions in which starting cell tracks are inored. However, cell tracks that begin outside an ROI and move into the ROI are not ignored.
You can set the boundaries by specifying Pixel values for X-Start (left side), X-End (right side), Y-Start (top), Y-End (Bottom). Use a pixel editor to find the x,y locations for the four sides. Then enter these pixel locations into the Experiment Description Box as demonstrated below. Its very important to type the parameters correctly with no spelling errors including the hash marks. The hash marks are used by the software to find your input.
Any number of exclusion regions may be specified simply by adding multiple EXCLUDE_ROI sections as demostrated below.
For more information on entering custom codes, please refer to this page:
"How to add custom codes". This code is applied when movies are tracked.
        EXCLUDE_ROI
        #   X-START =  453  #
        #   X-END   =  810  #
        #   Y-START =  765  #
        #   Y-END   =  1033 #
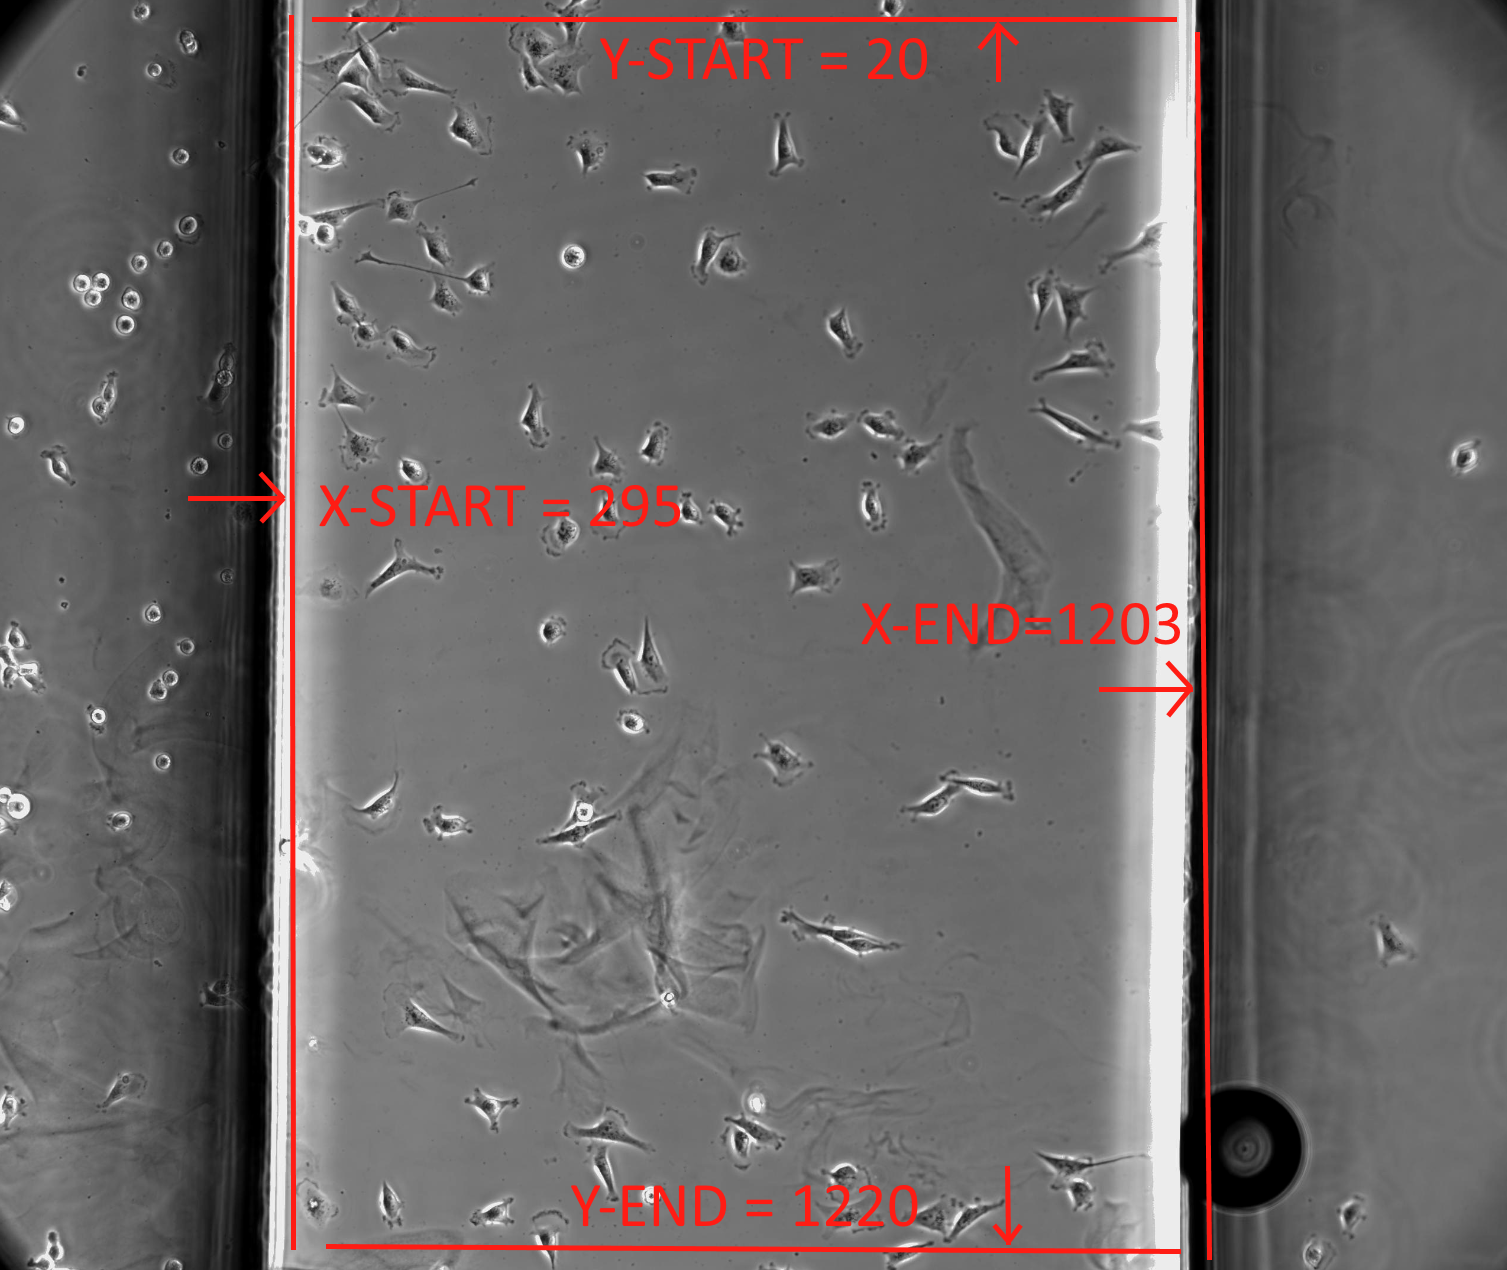
Manually Setting the Region of Interest
FastTrack AI attempts to automatically detect the ibidi chemotaxis chamber walls to limit cell tracking to an area within the chamber. But this automatic detection is not always possible. You can override the automatic detection manually. You can set the boundaries by specifying Pixel values for X-Start (left side), X-End (right side), Y-Start (top), Y-End (Bottom). Please use a pixel editor to find the x,y locations for the four sides. Then enter these pixel locations into the Experiment Description Box as demonstrated in the image below. Its very important to type the parameters correctly with no spelling errors including the hash marks. The hash marks are used by the software to find your input. For more information on entering custom codes, please refer to this page: "How to add custom codes". This code is applied when movies are tracked.
You may set a single ROI for all wells (positions) in all replicaates by entering the special code in the Experiment Description. Or (in advance mode) you may enter it in a replicate description to apply only to a replicate.
You can apply the ROI to specific wells by adding the optional FILE-NAME paremeter. The file name does not include the file extention (only use the text before the dot(.)).
Example applying to all files (a.k.a., positions,wells). Replace XPIXELVALUE and YPIXELVALUE with the x an y values.
    DEFINE_CHAMBER_DIMENSIONS
    #   X-START =  XPIXELVALUE   #
    #   X-END   =  XPIXELVALUE   #
    #   Y-START =  YPIXELVALUE   #
    #   Y-END =    YPIXELVALUE   #
Example applying to only specific files. For example, you have two files: A1.mp4 and A2.mp4. You may enter as many region descriptors as there are files in your replicate.
    DEFINE_CHAMBER_DIMENSIONS
    #   FILE-NAME = A1           #
    #   X-START =  XPIXELVALUE   #
    #   X-END   =  XPIXELVALUE   #
    #   Y-START =  YPIXELVALUE   #
    #   Y-END =    YPIXELVALUE   #

    DEFINE_CHAMBER_DIMENSIONS
    #   FILE-NAME = A2           #
    #   X-START =  XPIXELVALUE   #
    #   X-END   =  XPIXELVALUE   #
    #   Y-START =  YPIXELVALUE   #
    #   Y-END =    YPIXELVALUE   #

Accessing the Results
Reports are found at the top of the Replicate page as in the below image. For help navigating reports, please see the Reports page in the Help Center.
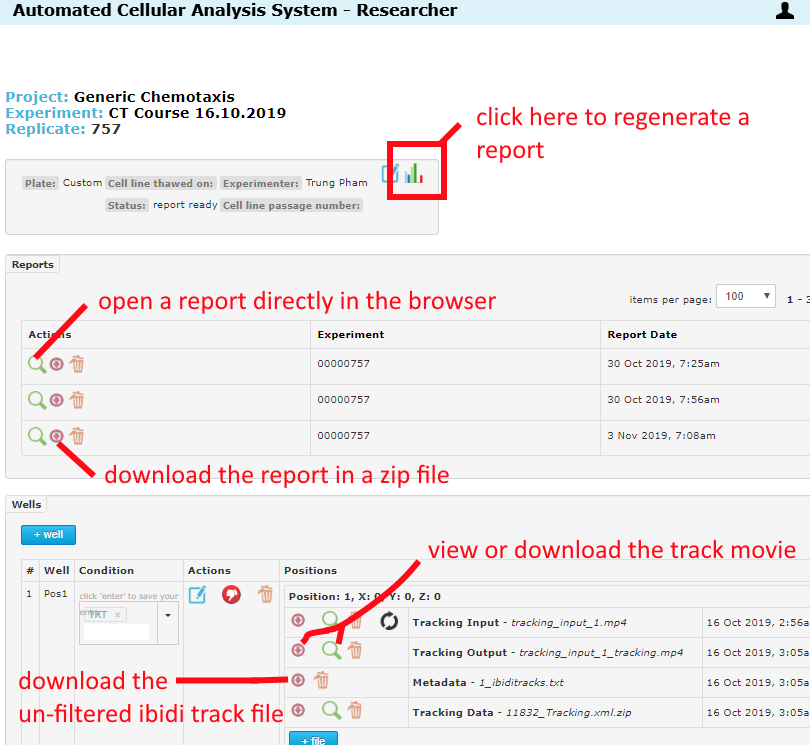
ibidi track files are text data with raw track information that can be imported into the ibidi track analysis tool. There are different ibidi track files generated:
- in each well there is an ibidi track file which contains all tracks.
- in the report csv data there are ibidi track files but the tracks have been filtered to remove cells that do not move or tracks t hat do not meet the user's minimum track duration setting.
- in the report csv data there are ibidi track files for each conditon group. If the user has specified conditions, then the well tracks are combined by condition.
Interpreting the Results
Below is an explanation of all the many parameters reported on each chemotaxis well and replicate analysis.
Euclidean Distance
Euclidean distance is the difference in x,y from the start of a track to the end of a track. Speeds can be measured in short intervals or by start to end of the track. We consider a speed measured over a euclidean distance to be a velocity. In other words, a cell that runs in circles and ends where it started will have a euclidean distance of zero and a velocity of zero. Yet while it was running it had a speed when evaluated in short intervals. In the reports you will see both speeds and velocities and total distance in both euclidean and non-euclidean terms. A non-euclidian distance is the total distance covered by a cell wether it ran in circles or a straight line.
Euclidean distance is effective as an indicator of directed cell movement (chemotaxis) since the cell should move in the direction of the gradient. If the cell moves in circles, then its likely not responding to a chemical stimulant.
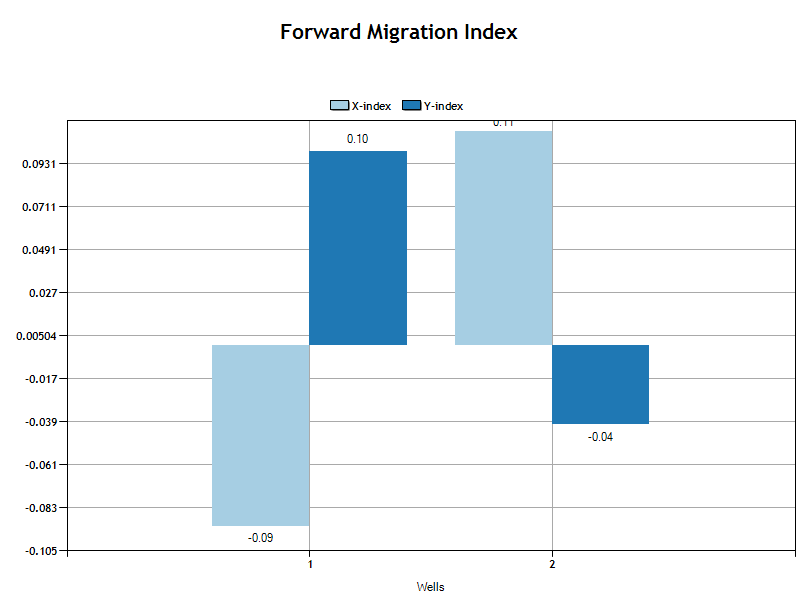
Forward Migration Index
The forward migration index is an indication of directed movement in each axis (x,y). A greater displace indicates more directed movement along that axis. The values are the average for all cell-tracks in the well or condition group. The code that generates the values is shown below.
                // distAccumMicrons[] - accumulated distance for each cell track
                // euclidDXMicrons[]  - X axis value of last point less the first point of the track
                // euclidDYMicrons[]  - Y axis value of last point less the first point of the track
                // totalValidCellTracks - number of tracks that exist that are greater than the minimum track duration

                for (int iCell = 0; iCell < rec.totalValidCellTracks; iCell++)
                {
                    // Forward migration index is the Euclid dist on the axis,
                    // divided by the accumulated dist of entire path
                    if (distAccumMicrons[iCell] > 0)
                    {
                        FMIX += euclidDXMicrons[iCell] / distAccumMicrons[iCell];
                        FMIY += euclidDYMicrons[iCell] / distAccumMicrons[iCell];
                    }
                }

                FMIX /= totalValidCellTracks;
                FMIY /= totalValidCellTracks;
Center of Mass Displacement
The center of mass displacement is the average euclidean distance for the X and Y components. This is an very consise indication of the average direction and magnitude of the overall cell movement in a well or condition group.
Euclidean distance is the distance (X,Y) from the last track position to the first track position.
                // euclidDistMicrons[] - euclidean distance for each cell track
                // euclidDXMicrons[]  - X axis value of last point less the first point of the track
                // euclidDYMicrons[]  - Y axis value of last point less the first point of the track

                for (int iCell = 0; iCell < rec.totalValidCellTracks; iCell++)
                {
                    euclidDXMicrons[iCell] = micronsPerPixel * (LastPos.x - FirstPos.x);
                    euclidDYMicrons[iCell] = micronsPerPixel * (LastPos.y - FirstPos.y);
                    euclidDistMicrons[iCell] = Math.Sqrt( euclidDXMicrons[iCell] * euclidDXMicrons[iCell] +
                                                          euclidDYMicrons[iCell] * euclidDYMicrons[iCell]);
                }

            // avgCenterOfMassDispX - is the average of the X component of euclidean distance
            // avgCenterOfMassDispY - is the average of the Y component of euclidean distance
            getStatistics(euclidDXMicrons, out avgCenterOfMassDispX_STD, out avgCenterOfMassDispX, out avgCenterOfMassDispX_SEM);
            getStatistics(euclidDYMicrons, out avgCenterOfMassDispY_STD, out avgCenterOfMassDispY, out avgCenterOfMassDispY_SEM);
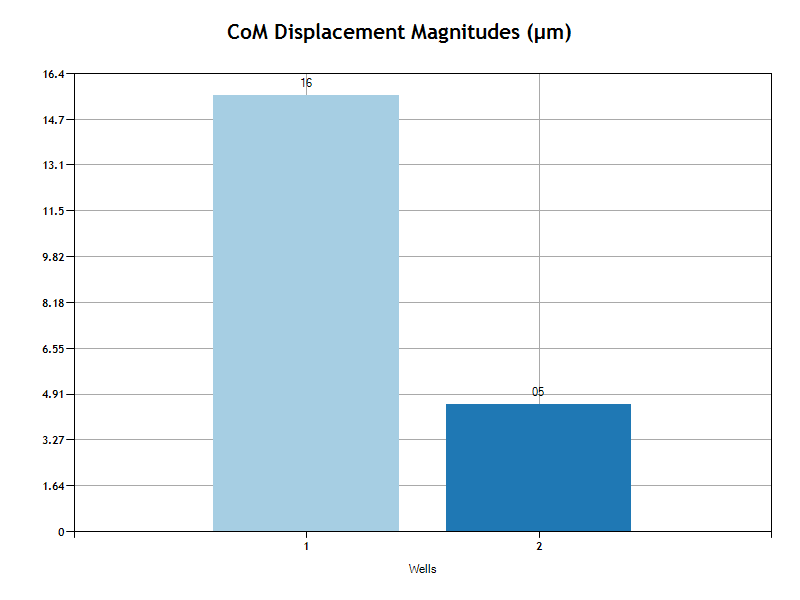
The polar chart shows the average direction and magnitude of center of mass displacement for cells in the well or condition group.
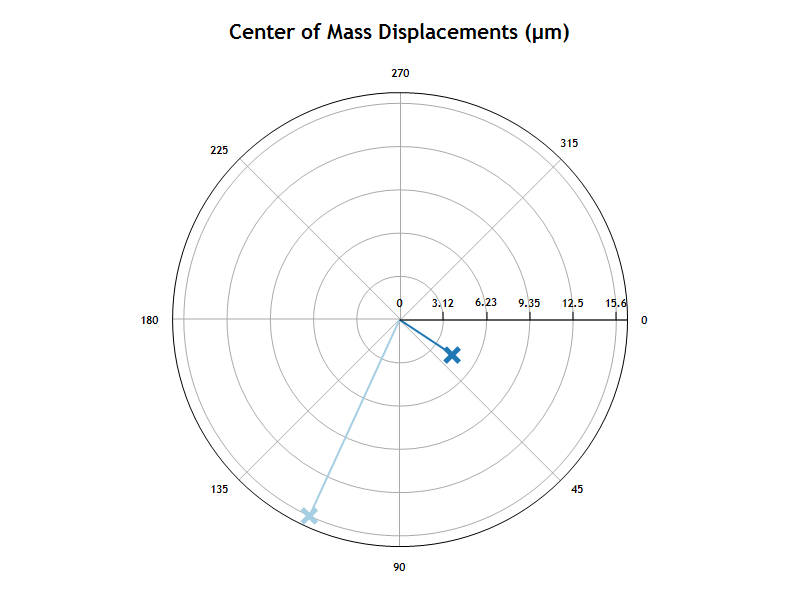
The bar chart shows the magnitude of the center of mass displacement average for all cells in the well or condition group.
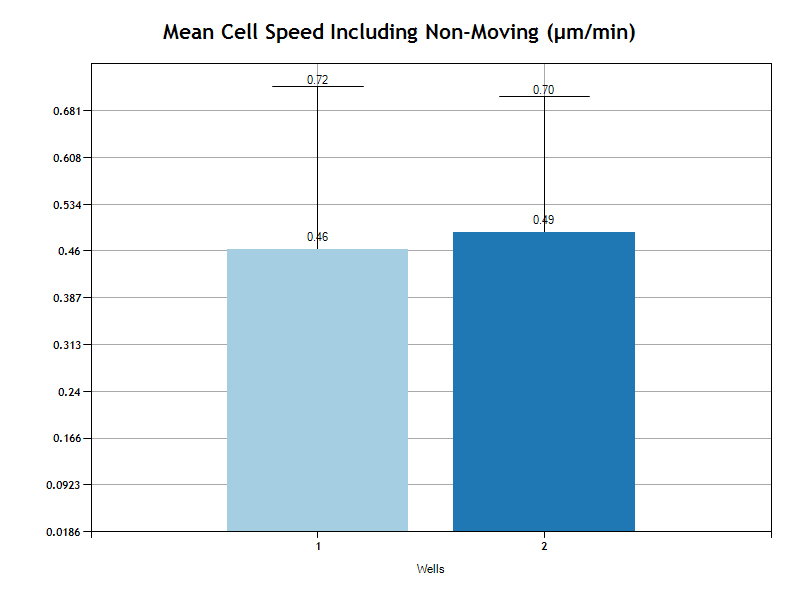
Mean Cell Speed
The Mean Cell Speed is the average of speed for all cells. Speed is calculated on time intervals. Based on the user's selection of "Evaluation Interval" in the Experiment setup page, each cell track will be analyzed in intervals. For example, if the Evaluation Interval is 120 seconds, then for each 120 second period of time, the speed will be determined as the distance change in that 120 second period divided by 120 seconds. The average speed for the track is the average of all interval speeds.
In one interval a cell may move 20 µm with a speed of 20µm/120s. In another interval the cell may not move at all and will have a speed of 0µm/120s. So the average speed over these two intervals will be 10µm/120s.
Each track has an average speed over all intervals in the track. The reported Mean Cell Speed is the average of the track averages.
The Mean cell speed is calculated twice, once including all tracks and once for only tracks where the euclidean distance is greater then the user specified Movement Threshold.
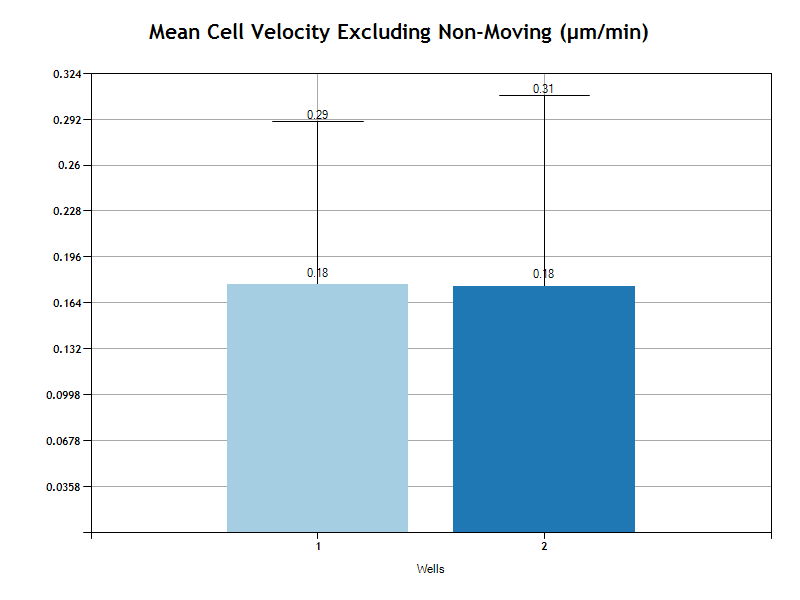
Mean Cell Velocity
The Mean Cell Velocity is the average velocity for all cells. Velocity is based on the euclidean distance. The velocity is the euclidean distance divided by the time duration of the entire track. In other words, if the cell runs in circles and ends up where it started, the velocity will be zero. But if the cell runs in a straight line, its velocity will be the final position less the first position divided by the life time of the track.
The Mean is the average of all the tracks in the well or condition group.
The Mean cell velocity is calculated twice, once including all tracks and once for only tracks where the euclidean distance is greater then the user specified Movement Threshold.