For additional assistance, please contact support@metavilabs.com.
Reports
Reports contain the results of the automated analysis. The reports are extensive and contain easy to read charts that give you instant results. The reports also include raw data in the form of csv files (comma seperated values that can be imported into excel and other analysis tools).
To open a report, open the Project, then open the Experiment, then open a Replicate.
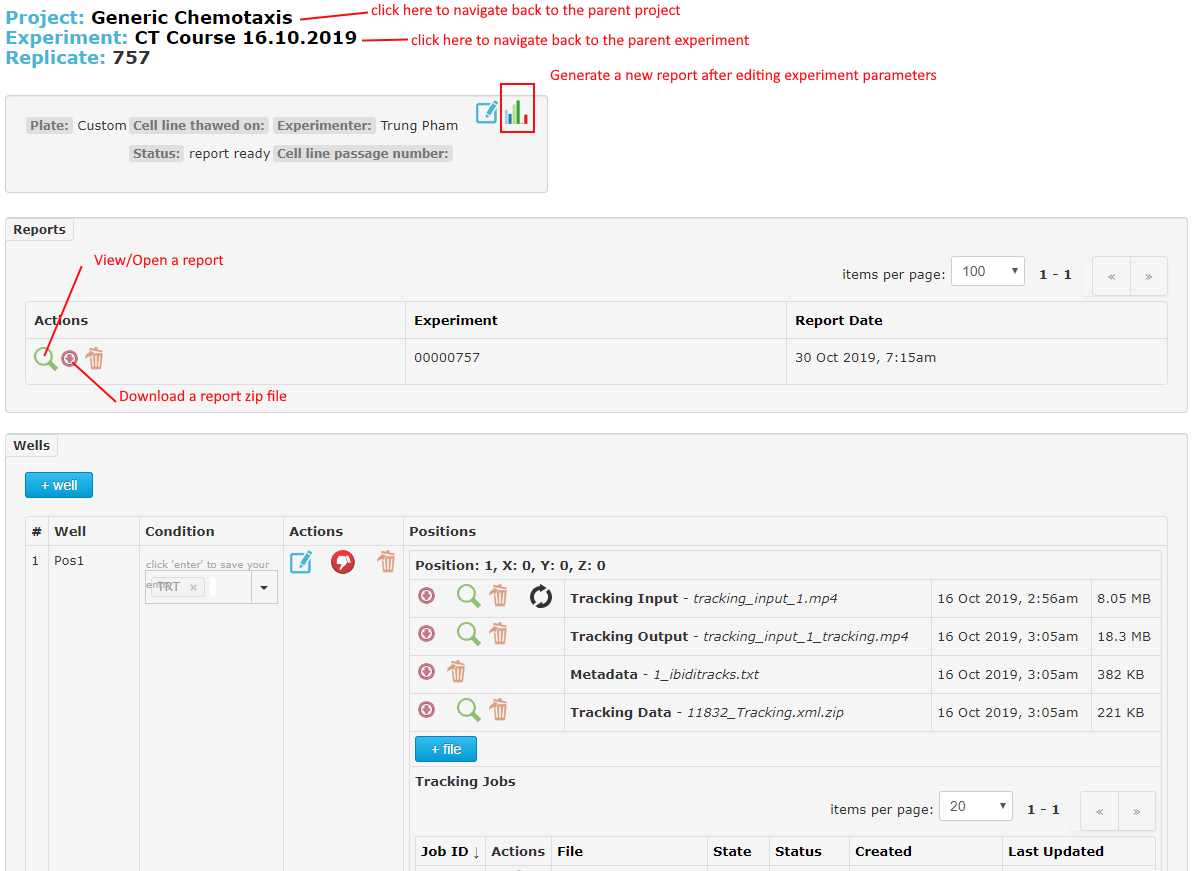
On the replicate page, you will see a Reports area that will contain a list of reports.
NOTE: a report will be automatically generated after all the wells have been analyzed. It can take some time for all the wells to be analyzed if there is a big queue of processing jobs. If you have one or more wells waiting for files to be uploaded no report will be generated. You can delete empty wells to trigger a report. Look for the Report Jobs link in the navigation menu to check on report status.
To view a report, click on the open icon (the green spy-glass). The report will open in a new tab of the browser. As reports contain a lot of data, it may take a few seconds for the report to open.
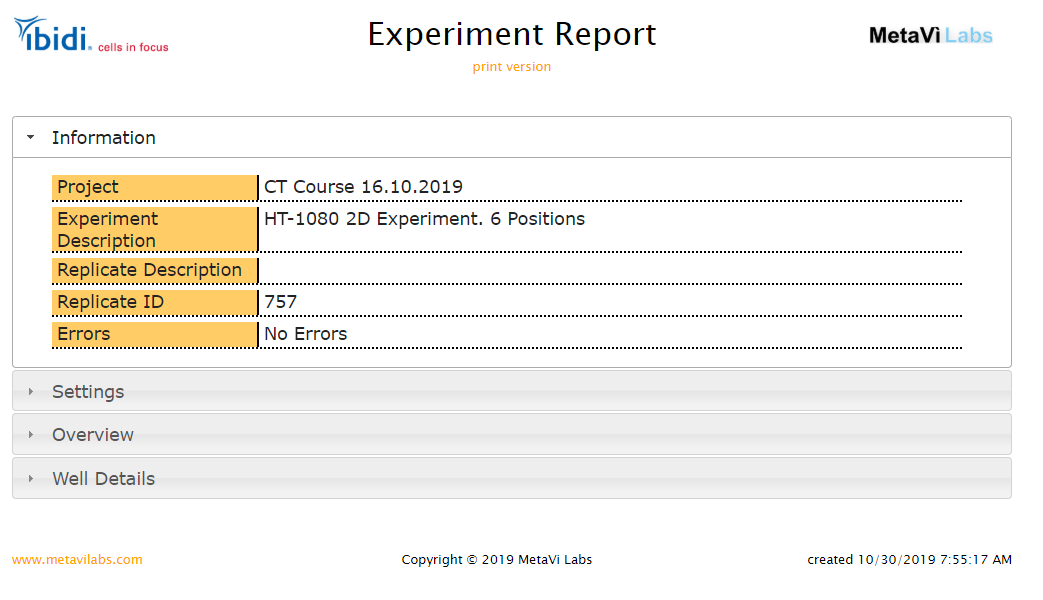
When you open a report, you will see four tabs. The Project Name, the Experiment Description, the Replicate Description, the Replicate ID, and Error status. If there were any processing errors, they would be reported here.
The Settings section lists all the settings from the Experiment. If you change any setting, you can create a new report. Each report will record the settings at the time of the report generation. You can edit the settings in the Experiment by navigating up to the Experiment level (link at the top of the page) then finding the edit icon in the Experiment page. (see the Experiment help center page or the help center page for your assay).
 Edit icon
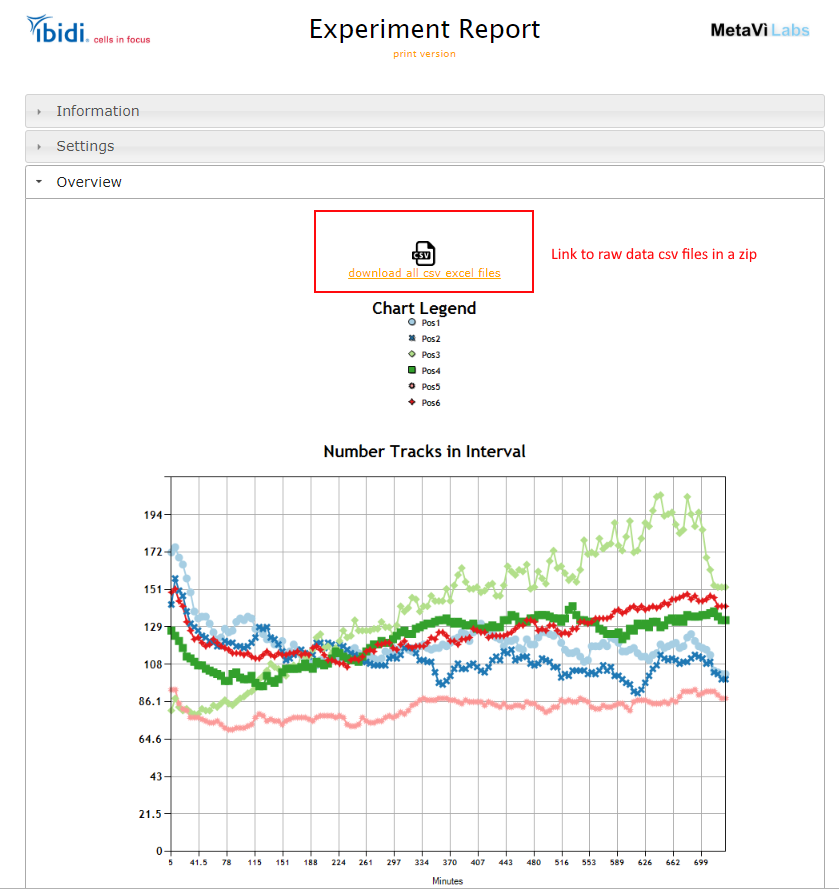
The Overview section of the report contains charts which compare the wells. The report is broken down into three sections:
- Link to raw data csv files
- Comparison of Well Results
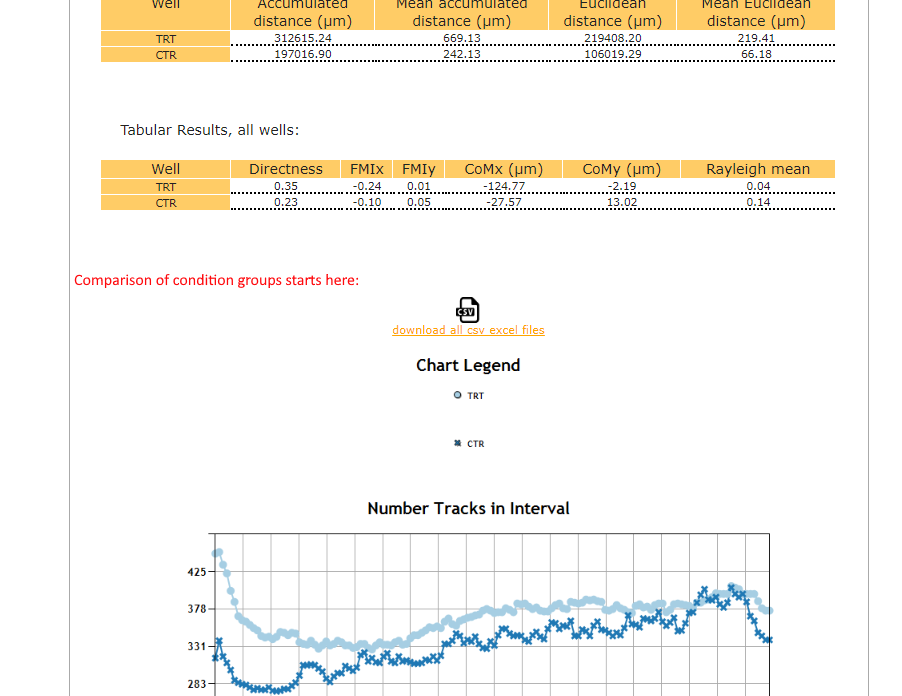
- Comparison of Condition Group Results
The raw data csv files are contained in a zip. Once extracted from the zip, these files contain data that can be directly imported into excel and other charting programs for further analysis. The data columns are seperated with commas.
The next section is the comparison of well results. Depending on the type of assay there may be up to twenty charts in this section allowing you compare all well results at a glance.
About half way down the overview section, you will find the comparisons of the conditions. Here the charts combine the data for each well in the same condition. For example in Chemotaxis, all the cell tracks from all wells of each condition are combined as if all the cells where in a single well.
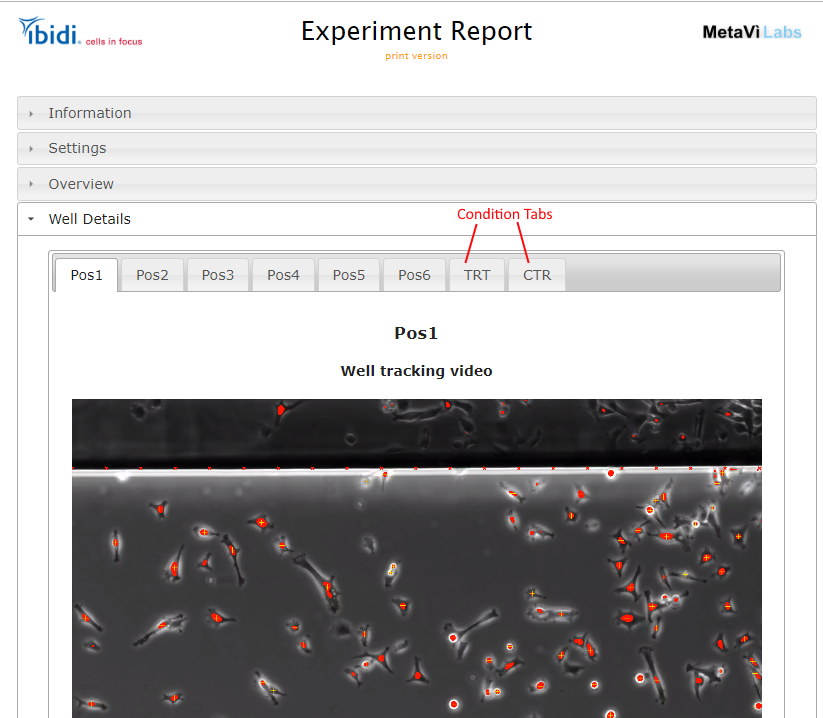
The Wells tab contains additional detailed results for individual wells. The condition groups are reported here as virtual wells. The condition wells will not have track movies, but they will contain all the same charts and graphs as the single wells.
To use report charts in your papers or internal documentation, you can right-click over any chart and your browser will give you the option to save the image locally. Or, your can download the report and un-zip it. In side the images folder you will find all the charts contained in the report.
