For additional assistance, please contact support@metavilabs.com.
Wound Healing Assay
The wound healing assay compares gap closure time between multiple wells in time-lapse movies.
When using the ibidi wound healing kits, your gap will be a clean straight gap of 0.5 mm.
When creating a Wound Healing analysis, be sure to correctly enter the image resolution in pixels per µm. This value is used to determine the surface area in µm². Typical values for the image resolution are 0.5 (low resolution) to 2.0 (high resolution). Please see the help center page on determining the pixel resolution for more information.
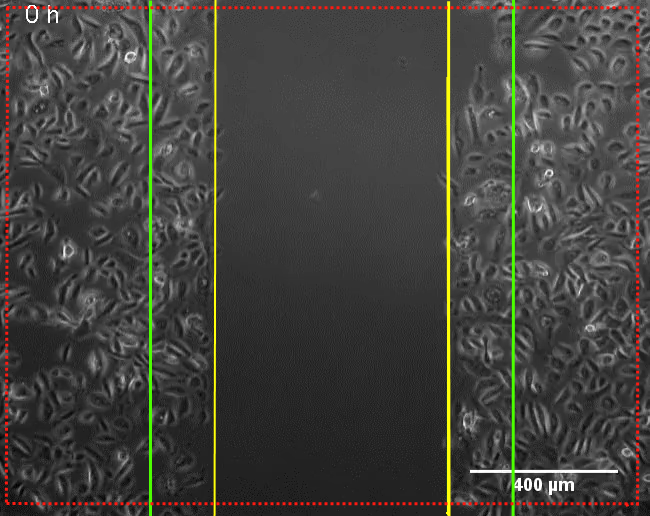
The microscope should be setup to use Phase Contrast as it will provide an image with maximum constrast of the covered area (see example below).
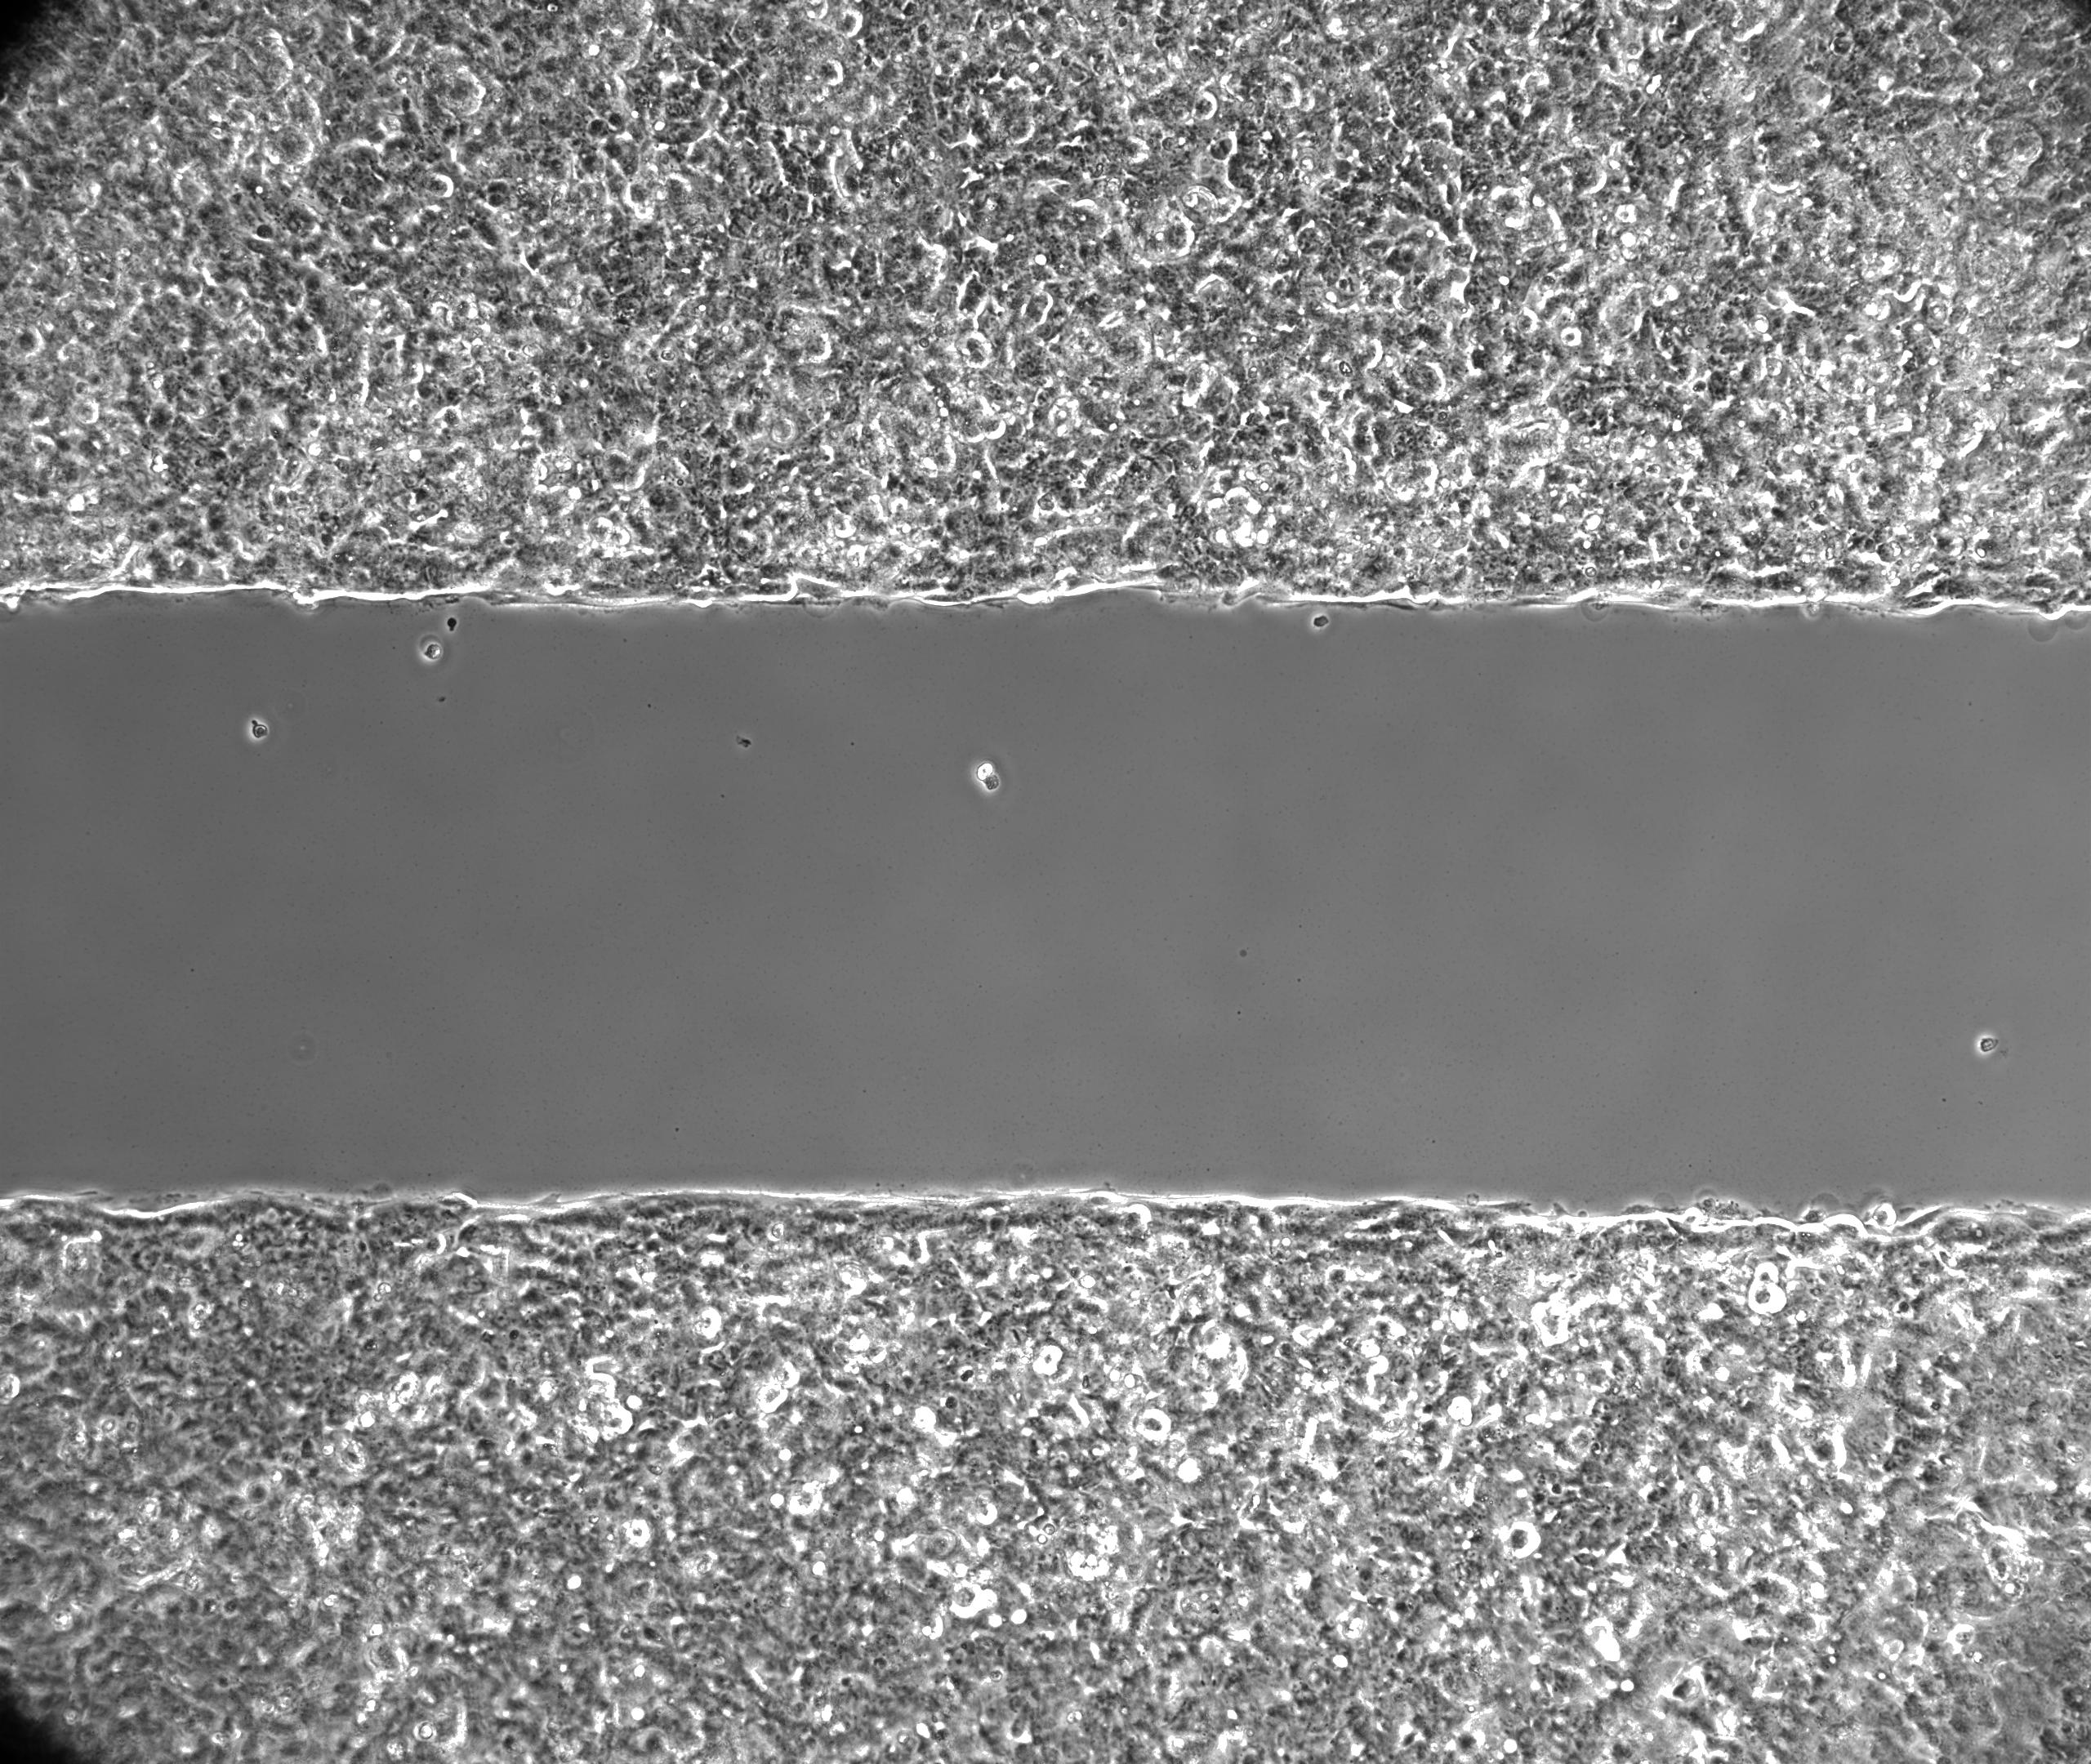
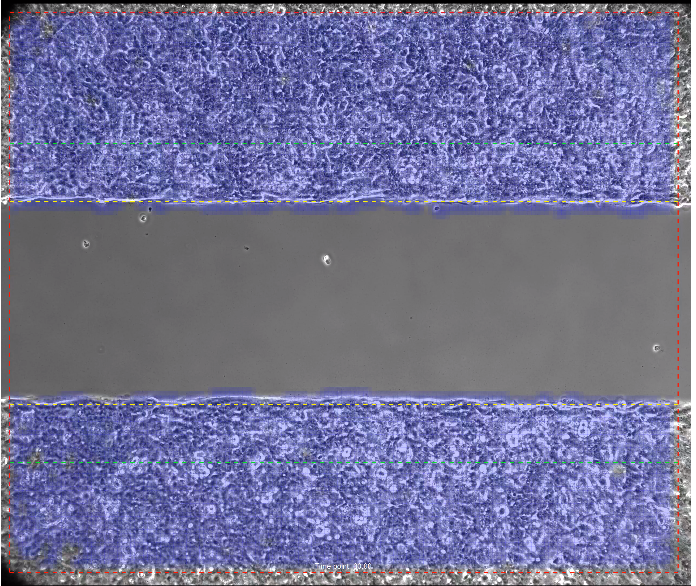
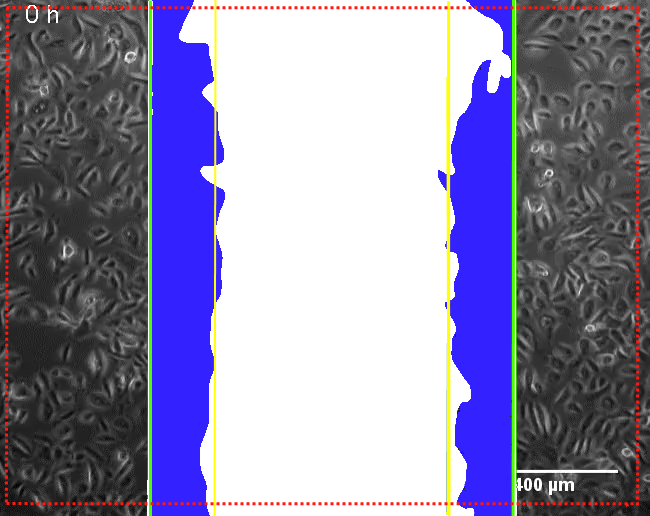
With a highly contrasted image, the analysis algorithms will be able to identify the covered and un-covered areas:
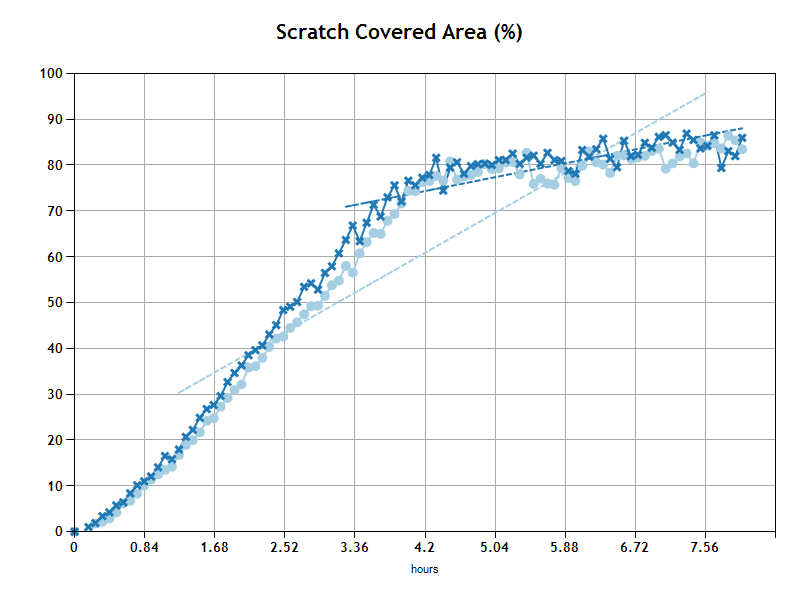
The primary output of this analysis is the time for gaps to reach closure. The analysis compares results from different wells so you can see immediately how conditions(or conditions) compare from well to well.
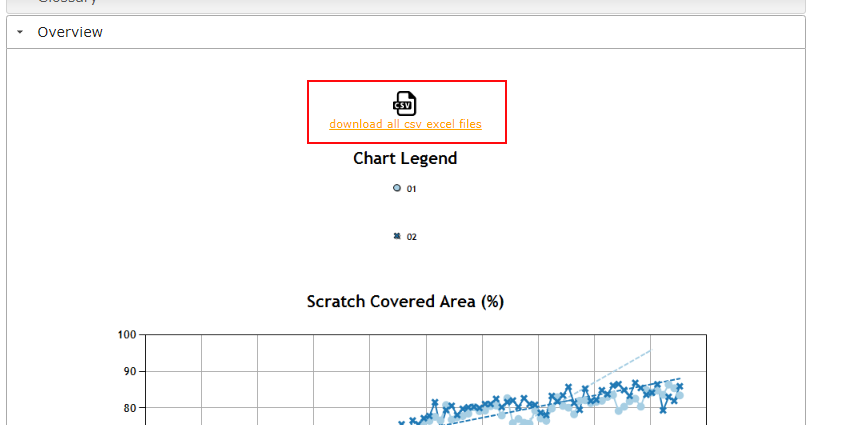
All of the raw data is available in csv files (comma seperated values) that can be imported into excel and other analysis software. To access the data, just click on the link "download all csv excel files" in the report Overview section.
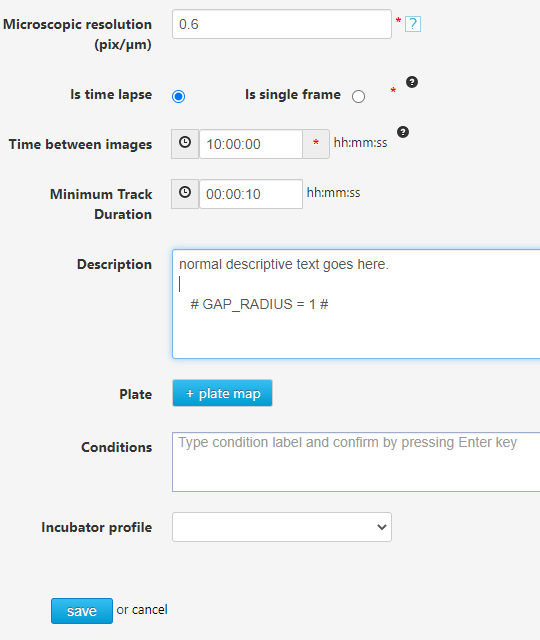
Since cells are mostly transparent there will be visible gaps between the edges visible in phase contrast. The algorithm assigns a pixel expansion value to fill small gaps. The user can override the default value with the following custom code. For more information on entering custom codes, please refer to this page: "How to add custom codes". This code is applied when movies are tracked.
# GAP_RADIUS = 1 #
All of the measurements are defined in the glossary table below.
Glossary
| Term | Unit of Measure | Definition |
| Analyzed Area Margin | µm² | The red outside line on Pic 1 and Pic 2 indicates the margin. Outside the margin algorithms cannot reliably detect structures, so this region is omitted from the analysis. The width of the margin is dependent on the resolution. The higher the resolution the smaller the margin. |
| Report Time Interval (RTI) | time unit | Dynamically calculated based on the experiment setting Time between images value and total experiment duration. Can be one of the following: minutes, seconds, hours, days. |
| Time Point | time unit | Moment in time based on setting RTI value. Starts from 0 which corresponds to the first image of the experiment recording. |
| Initial Scratch Region | µm² | Area between vertical green lines on Pic 1 and Pic 2, which is 10% wider on each side of the scratch, increasing scratch analysis area. |
| Starting Scratch Covered Area | µm² | Area marked blue on Pic 2 at Time point 0. |
| Starting Scratch Open Area | µm² | Area marked white on Pic 2 at Time point 0. |
| Total Area | µm² | Area within Analyzed Area Margin at given time point. |
| Total Covered Area | µm² | Area within Analyzed Area Margin covered by cells at given time point. |
| Total Open Area | µm² | Area within Analyzed Area Margin not covered by cells (open) at given time point. |
| Scratch Covered Area | µm² | Area within green lines on Pic 1 and Pic 2 covered by cells at given time point. |
| Scratch Open Area | µm² | Area within green lines on Pic 1 and Pic 2 not covered by cells (open) at given time point. |
| Scratch Covered Area % | % | Percentage covered by cells scratch area (Starting Scratch Open Area - Scratch Open Area) of the total Starting Scratch Open Area at given time point. |
| Scratch Open Area % | % | Percentage uncovered scratch area (100% - Scratch Covered Area %) |
| Scratch Closure Speed, Zero-to-Peak Interval | µm²/RTI | Speed at which scratch open area is closing during the experiment starting from Time point 0 to time point with maximum value of Scratch Covered Area. |
| Scratch Closure Speed, Linear Fit Interval | µm²/RTI | Speed at which scratch not covered by cells (open) area is closing during the experiment in the interval where scratch open area is closing with consistent pace fitting linear filter. |
|
|
